Summary
Averaged over every day of the week, Australians aged 15 and over spend about eight hours a day on paid work, study and unpaid work combined. Females averaged 8:01 and males 7:56, a gap of 5 minutes that is not statistically significant. The difference is in the mix: unpaid work makes up 55% of females' total and 39% of males' [C20].
The longest days belong to parents of children under 15. Partnered parents averaged 10:56 of paid work, study and unpaid work combined, 178 minutes more than the 7:58 average for all people aged 15 and over; lone parents with children under 15 averaged 10:38 [C21]. Female and male partnered parents worked similar totals (11:02 and 10:50), but 68% of the female parents' working time was unpaid, against 42% for male parents [C22].
One in three people aged 15 and over (33.1%) always or often feel rushed or pressed for time [C12], rising to 50.7% of partnered parents with children under 15 [C13].
The report draws on the Australian Bureau of Statistics 2024 Time Use Survey. We restructured all 25,110 published values into one dataset, with ABS error measures and source cells, and release it with this report.
At a glance
Paid work, study and unpaid work combined, per day, for females and males aged 15 and over [C20]
Paid work, study and unpaid work combined, per day, for partnered parents with children under 15 [C21]
Share of female partnered parents' working time that is unpaid, against 42% for male partnered parents [C22]
People aged 15 and over who always or often feel rushed or pressed for time [C12]
Key findings
1Females and males work similar hours in total; more of females' work is unpaid
Counting paid work, study and unpaid work together, females averaged 8:01 a day and males 7:56, a difference that is not statistically significant [C20]. Females did 75 minutes more unpaid work (4:23 against 3:08) [C01]; males spent 70 minutes more on paid work and study (4:48 against 3:38) [C02]. See Table 12 and Figure 7.
2Parents of children under 15 have the longest working day
Partnered parents with children under 15 averaged 10:56 a day of paid work, study and unpaid work combined, and lone parents 10:38, against 7:58 for everyone aged 15 and over [C21]. Lone parents did more unpaid work than partnered parents (6:55 against 5:58) [C03, C04], but most lone parents are female (about 84%, against about 49% of partnered parents); compared female with female, the difference in unpaid work is no longer statistically significant (7:10 and 7:27) [C18]. See Table 1.
3With a baby at home, female parents spend about 2.5 times as long on childcare as male parents
Where the youngest child was under 1, female parents averaged 7:27 a day looking after children as their main activity and male parents 2:57, about 2.5 times as long [C11]. Childcare time falls steeply as children grow, from 5:17 a day for all parents of a child under 1 to 1:02 for parents whose youngest child is 12–14 [C10]. See Table 8 and Figure 4.
4Free time ranges from under three hours to more than seven
Partnered parents with children under 15 averaged 2:58 of free time a day; people aged 65 and over living alone averaged 7:34 [C06]. See Table 1 and Figure 1.
5Half of parents of children under 15 always or often feel rushed
33.1% of people aged 15 and over always or often feel rushed [C12]. The share is 50.7% for partnered parents and 49.5% for lone parents with children under 15, and 6.7% for people aged 65 and over living alone [C13]. See Table 9 and Figure 5.
6Work–family balance is the reason most often given
Among people who always or often feel rushed, 41.5% named balancing work and family as the main reason and 20.5% named work [C16]. See Table 10 and Figure 6.
1. About this report
Many household decisions trade money against time: cooking or buying a meal, keeping up the garden or paying for help, driving children to activities or arranging something else. This report covers the time side; the Australian Spending Report 2026 covers spending. The two draw on different surveys and are not combined.
The ABS Time Use Survey is the most detailed official record of how Australians spend their days, but ABS releases it as 14 separate data cubes. This report brings those tables together around life stage, adds a combined measure of paid and unpaid work that ABS does not publish, and releases the restructured data with the error measure and source cell for every value.
The report answers four questions:
- How do people at different life stages divide the day between paid work and study, unpaid work, care and free time?
- What does unpaid work consist of?
- Who feels rushed, and what reasons do they give?
- How long is the full working day once paid work, study and unpaid work are added together?
Section 6 sets out what the data cannot answer.
2. How the day is divided
Living situation shapes the day
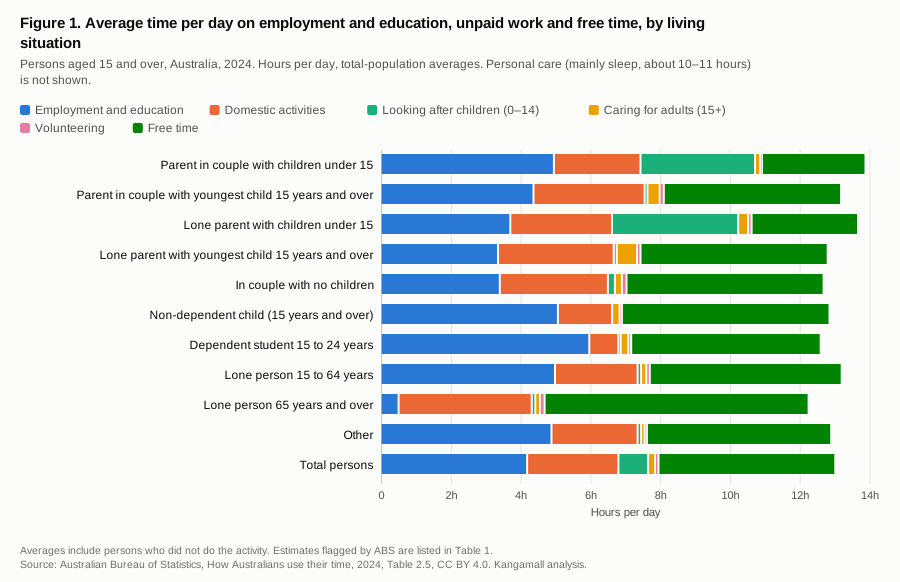
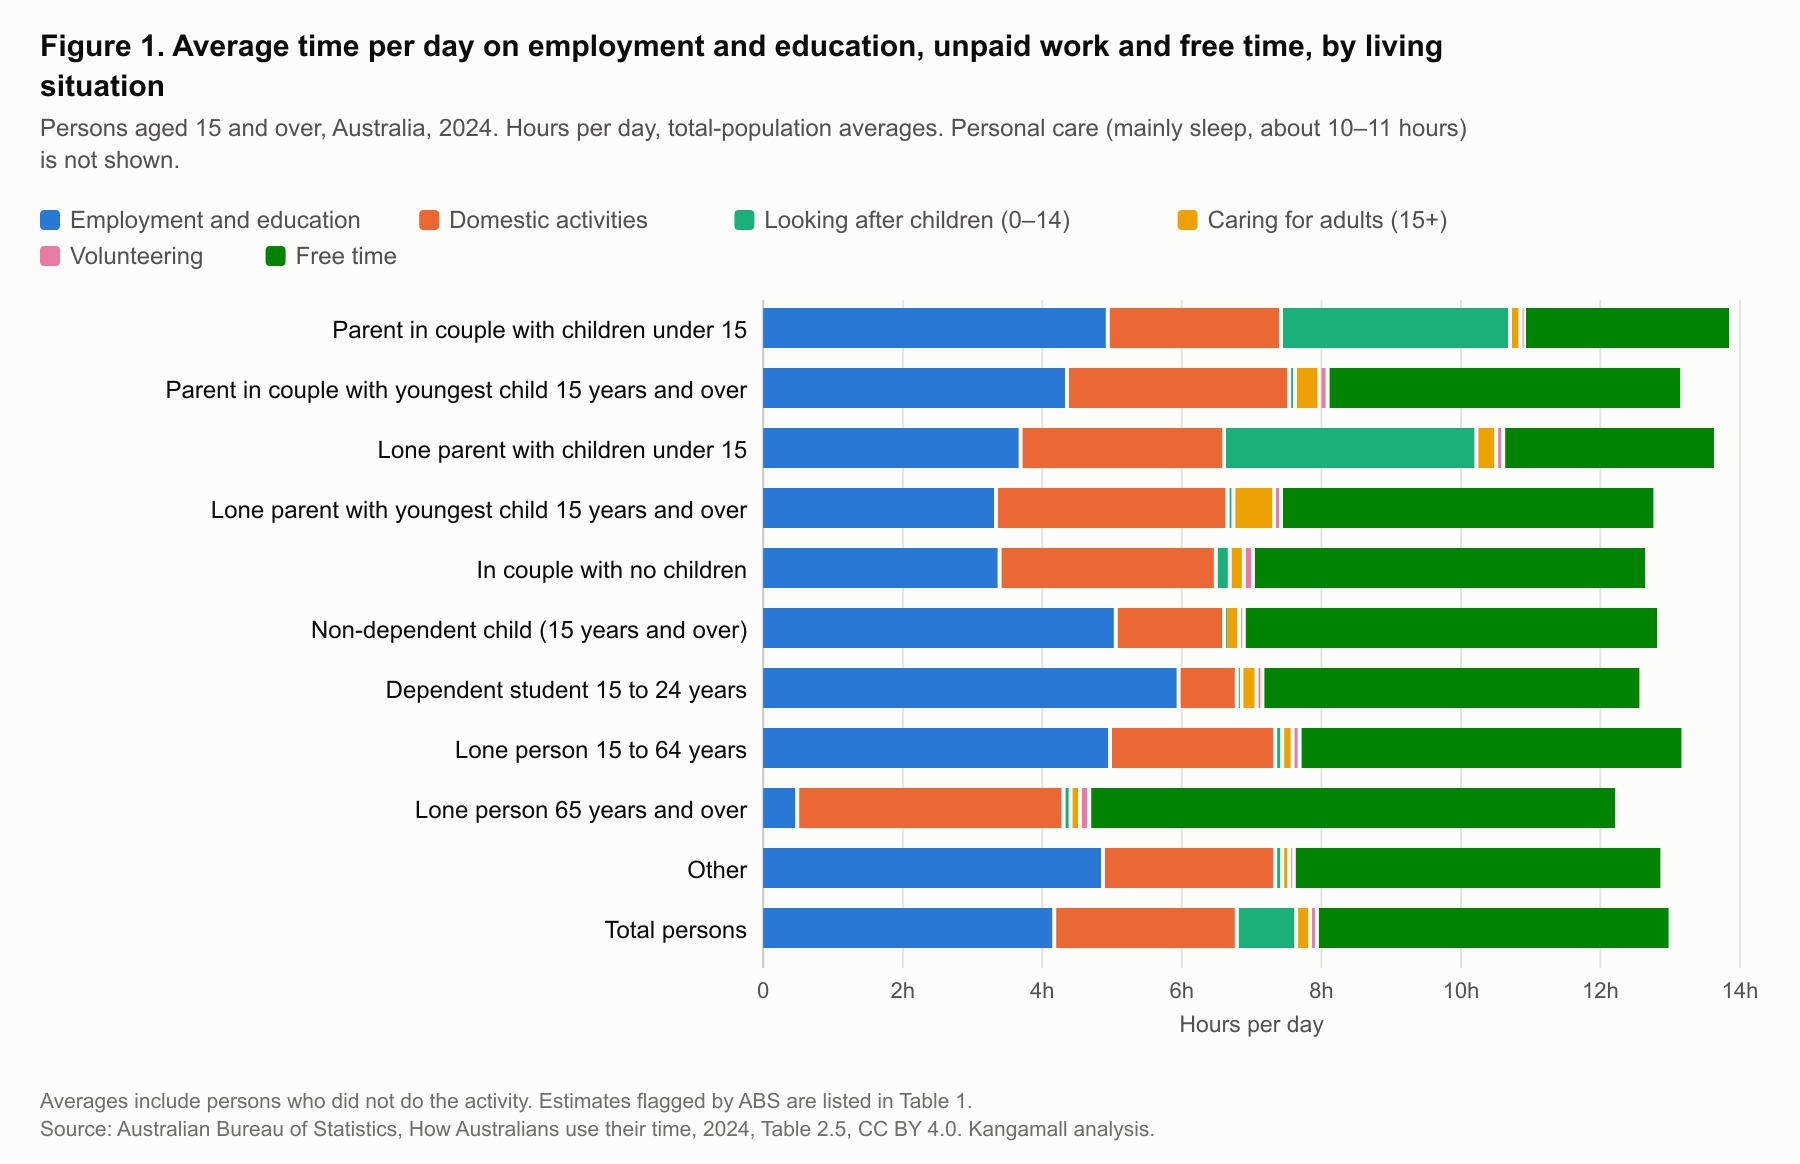
Figure 1. How the day is divided, by living situation
Hours:minutes per day, total-population averages. Personal care is not shown.- Parent in couple with children under 15Free time 2:58
- Parent in couple with youngest child 15 years and overFree time 5:05
- Lone parent with children under 15Free time 3:03
- Lone parent with youngest child 15 years and overFree time 5:22
- In couple with no childrenFree time 5:39
- Non-dependent child (15 years and over)Free time 5:57
- Dependent student 15 to 24 yearsFree time 5:26
- Lone person 15 to 64 yearsFree time 5:30
- Lone person 65 years and overFree time 7:34
- OtherFree time 5:17
- Total personsFree time 5:04
View Figure 1 data as a table
| living situation | activity | minutes per day | abs quality flag |
|---|---|---|---|
| Parent in couple with children under 15 | Employment and education | 298.0 (4:58) | |
| Parent in couple with children under 15 | Domestic activities | 149.0 (2:29) | |
| Parent in couple with children under 15 | Looking after children (0–14) | 197.0 (3:17) | |
| Parent in couple with children under 15 | Caring for adults (15+) | 9.0 (0:09) | |
| Parent in couple with children under 15 | Volunteering | 3.0 (0:03) | |
| Parent in couple with children under 15 | Free time | 178.0 (2:58) | |
| Parent in couple with youngest child 15 years and over | Employment and education | 263.0 (4:23) | |
| Parent in couple with youngest child 15 years and over | Domestic activities | 191.0 (3:11) | |
| Parent in couple with youngest child 15 years and over | Looking after children (0–14) | 5.0 (0:05) | |
| Parent in couple with youngest child 15 years and over | Caring for adults (15+) | 21.0 (0:21) | |
| Parent in couple with youngest child 15 years and over | Volunteering | 7.0 (0:07) | |
| Parent in couple with youngest child 15 years and over | Free time | 305.0 (5:05) | |
| Lone parent with children under 15 | Employment and education | 223.0 (3:43) | |
| Lone parent with children under 15 | Domestic activities | 175.0 (2:55) | |
| Lone parent with children under 15 | Looking after children (0–14) | 217.0 (3:37) | |
| Lone parent with children under 15 | Caring for adults (15+) | 17.0 (0:17) | caution_rse_25_to_50 |
| Lone parent with children under 15 | Volunteering | 6.0 (0:06) | caution_rse_25_to_50 |
| Lone parent with children under 15 | Free time | 183.0 (3:03) | |
| Lone parent with youngest child 15 years and over | Employment and education | 202.0 (3:22) | |
| Lone parent with youngest child 15 years and over | Domestic activities | 199.0 (3:19) | |
| Lone parent with youngest child 15 years and over | Looking after children (0–14) | 5.0 (0:05) | caution_rse_25_to_50 |
| Lone parent with youngest child 15 years and over | Caring for adults (15+) | 35.0 (0:35) | |
| Lone parent with youngest child 15 years and over | Volunteering | 6.0 (0:06) | caution_rse_25_to_50 |
| Lone parent with youngest child 15 years and over | Free time | 322.0 (5:22) | |
| In couple with no children | Employment and education | 205.0 (3:25) | |
| In couple with no children | Domestic activities | 186.0 (3:06) | |
| In couple with no children | Looking after children (0–14) | 12.0 (0:12) | |
| In couple with no children | Caring for adults (15+) | 12.0 (0:12) | |
| In couple with no children | Volunteering | 8.0 (0:08) | |
| In couple with no children | Free time | 339.0 (5:39) | |
| Non-dependent child (15 years and over) | Employment and education | 305.0 (5:05) | |
| Non-dependent child (15 years and over) | Domestic activities | 93.0 (1:33) | |
| Non-dependent child (15 years and over) | Looking after children (0–14) | 1.0 (0:01) | caution_rse_25_to_50 |
| Non-dependent child (15 years and over) | Caring for adults (15+) | 12.0 (0:12) | |
| Non-dependent child (15 years and over) | Volunteering | 4.0 (0:04) | caution_rse_25_to_50 |
| Non-dependent child (15 years and over) | Free time | 357.0 (5:57) | |
| Dependent student 15 to 24 years | Employment and education | 359.0 (5:59) | |
| Dependent student 15 to 24 years | Domestic activities | 50.0 (0:50) | |
| Dependent student 15 to 24 years | Looking after children (0–14) | 4.0 (0:04) | caution_rse_25_to_50 |
| Dependent student 15 to 24 years | Caring for adults (15+) | 13.0 (0:13) | |
| Dependent student 15 to 24 years | Volunteering | 5.0 (0:05) | caution_rse_25_to_50 |
| Dependent student 15 to 24 years | Free time | 326.0 (5:26) | |
| Lone person 15 to 64 years | Employment and education | 300.0 (5:00) | |
| Lone person 15 to 64 years | Domestic activities | 142.0 (2:22) | |
| Lone person 15 to 64 years | Looking after children (0–14) | 6.0 (0:06) | |
| Lone person 15 to 64 years | Caring for adults (15+) | 9.0 (0:09) | |
| Lone person 15 to 64 years | Volunteering | 6.0 (0:06) | |
| Lone person 15 to 64 years | Free time | 330.0 (5:30) | |
| Lone person 65 years and over | Employment and education | 31.0 (0:31) | |
| Lone person 65 years and over | Domestic activities | 229.0 (3:49) | |
| Lone person 65 years and over | Looking after children (0–14) | 6.0 (0:06) | |
| Lone person 65 years and over | Caring for adults (15+) | 8.0 (0:08) | |
| Lone person 65 years and over | Volunteering | 8.0 (0:08) | |
| Lone person 65 years and over | Free time | 454.0 (7:34) | |
| Other | Employment and education | 294.0 (4:54) | |
| Other | Domestic activities | 148.0 (2:28) | |
| Other | Looking after children (0–14) | 6.0 (0:06) | caution_rse_25_to_50 |
| Other | Caring for adults (15+) | 6.0 (0:06) | caution_rse_25_to_50 |
| Other | Volunteering | 4.0 (0:04) | caution_rse_25_to_50 |
| Other | Free time | 317.0 (5:17) | |
| Total persons | Employment and education | 252.0 (4:12) | |
| Total persons | Domestic activities | 157.0 (2:37) | |
| Total persons | Looking after children (0–14) | 51.0 (0:51) | |
| Total persons | Caring for adults (15+) | 12.0 (0:12) | |
| Total persons | Volunteering | 6.0 (0:06) | |
| Total persons | Free time | 304.0 (5:04) |
Lone parents with children under 15 averaged 6:55 of unpaid work a day and partnered parents with children under 15 5:58, a statistically significant gap of 57 minutes [C04]. Lone parents spent less time on paid work and study (3:43 against 4:58) [C05].
Part of the gap reflects who lone parents are
About 84% of lone parents with children under 15 are female, compared with about 49% of partnered parents. Compared female with female, lone and partnered parents spent similar time on unpaid work (7:10 and 7:27) and on paid work and study (3:20 and 3:35); neither difference is statistically significant [C18].
Free time is scarcest for parents of young children
Partnered parents with children under 15 had the least free time, 2:58 a day, close to lone parents with children under 15 (3:03). People aged 65 and over living alone had the most, 7:34 [C06]. Tables 2 and 3 give the same breakdown by age group and labour force status.
Females do more unpaid work; males more paid work and study
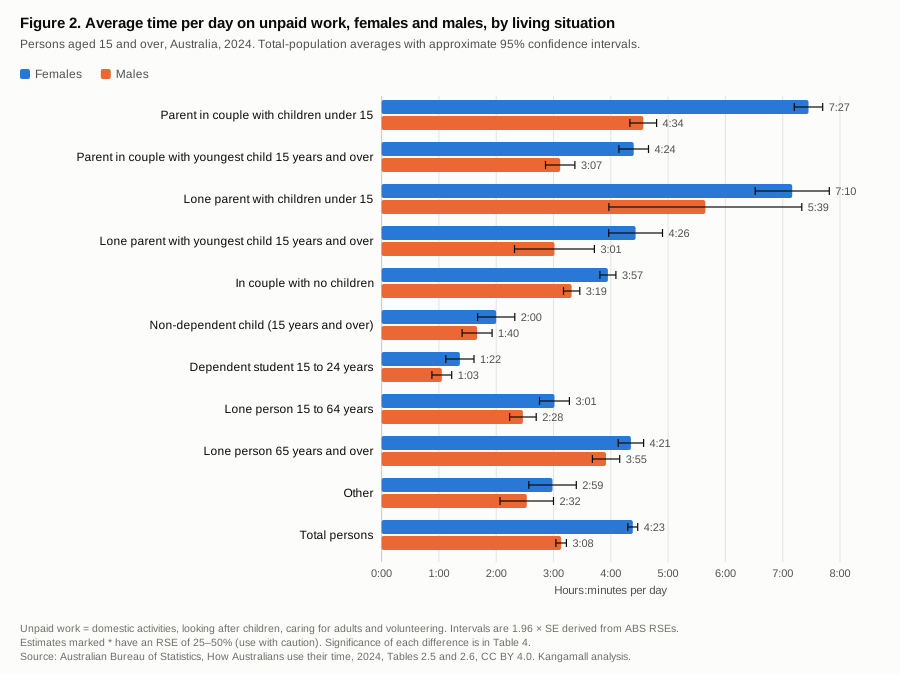
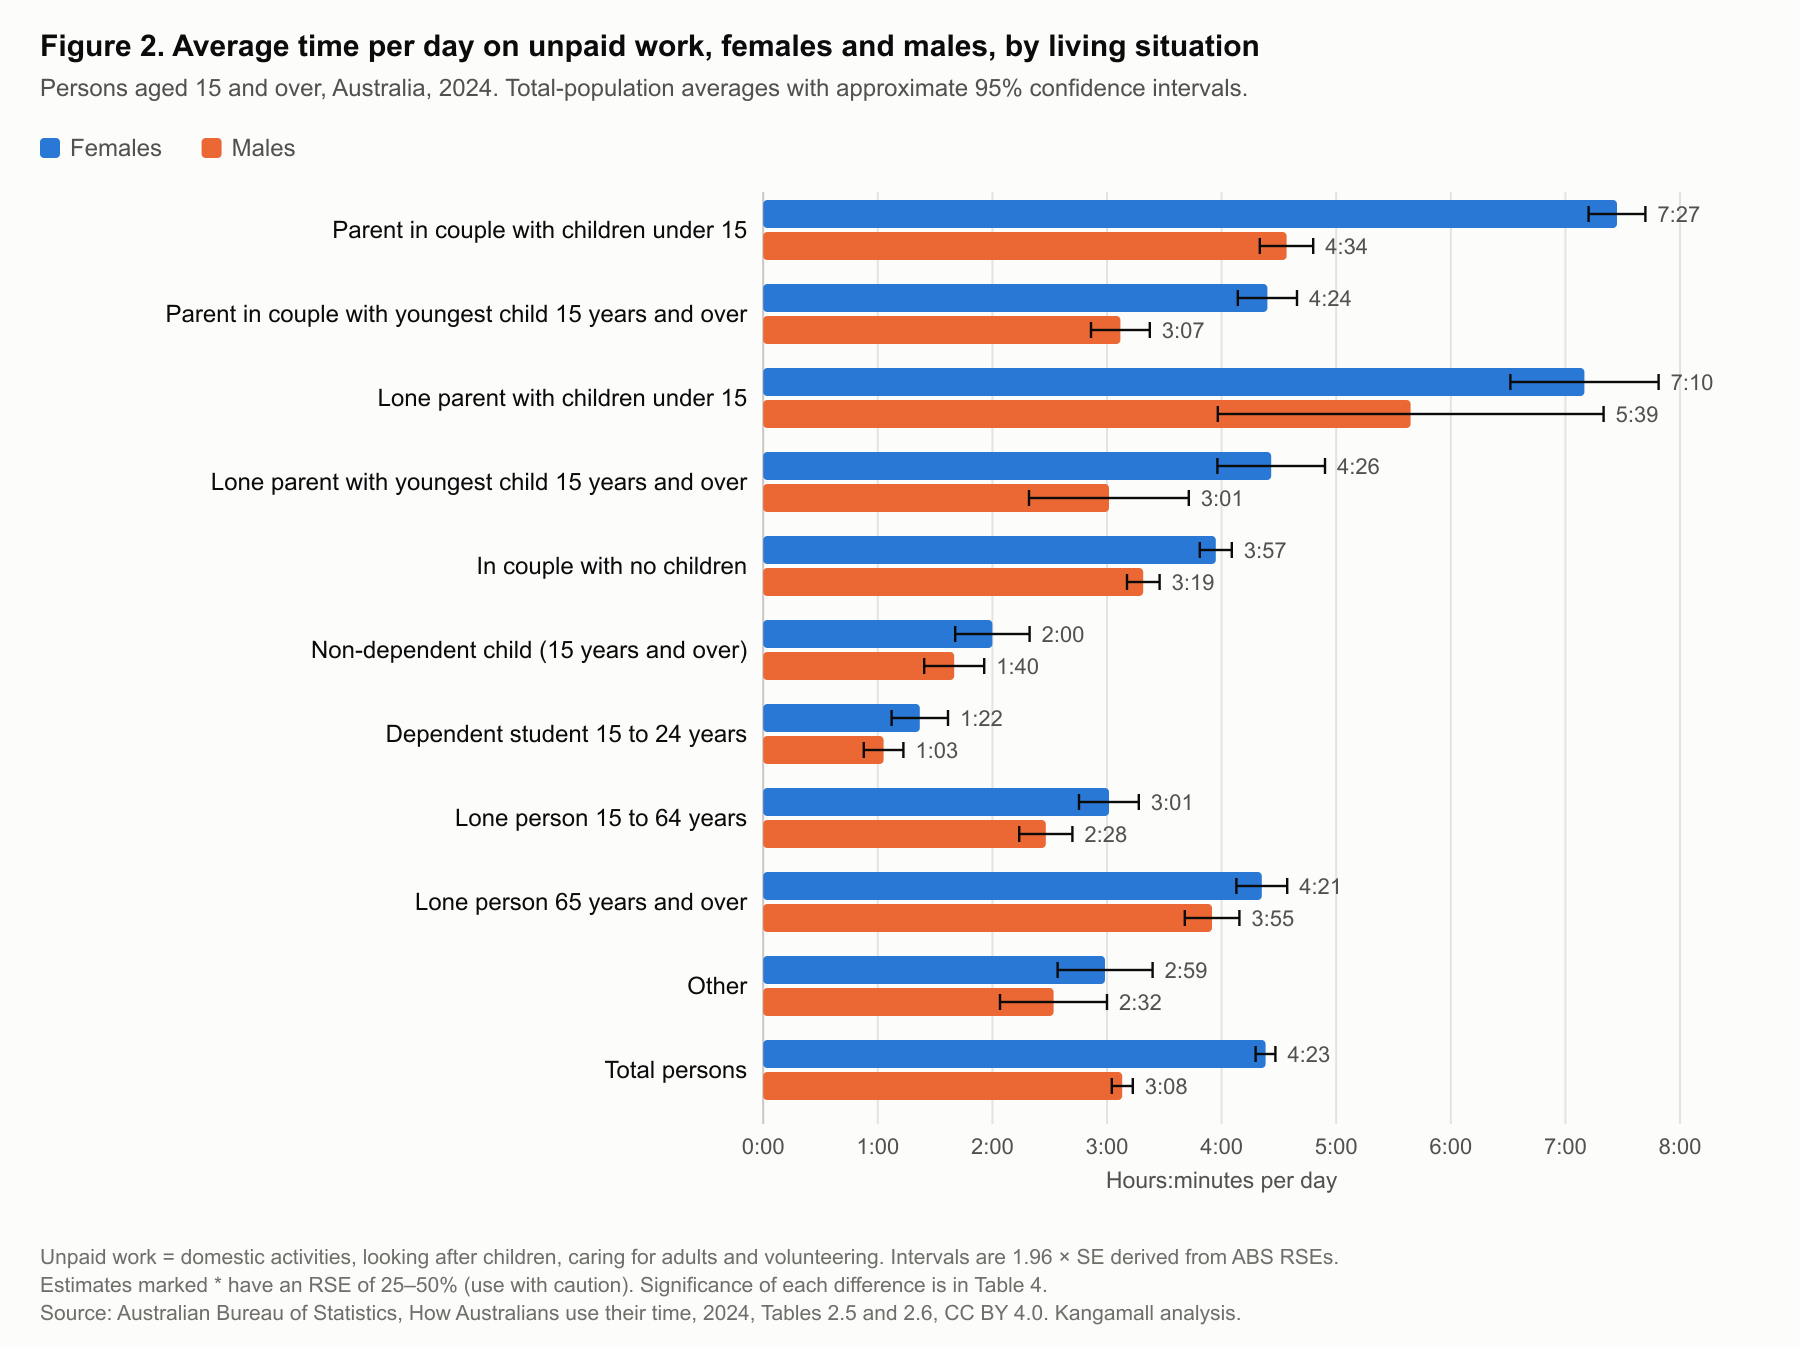
Figure 2. Unpaid work, females and males
Hours:minutes per day, total-population averages.Parent in couple with children under 15
Females7:27Males4:34Parent in couple with youngest child 15 years and over
Females4:24Males3:07Lone parent with children under 15
Females7:10Males5:39Lone parent with youngest child 15 years and over
Females4:26Males3:01In couple with no children
Females3:57Males3:19Non-dependent child (15 years and over)
Females2:00Males1:40Dependent student 15 to 24 years
Females1:22Males1:03Lone person 15 to 64 years
Females3:01Males2:28Lone person 65 years and over
Females4:21Males3:55Other
Females2:59Males2:32Total persons
Females4:23Males3:08
View Figure 2 data as a table
| living situation | sex | minutes per day | ci95 half width minutes | abs quality flag |
|---|---|---|---|---|
| Parent in couple with children under 15 | Females | 447.0 (7:27) | 14.9 | |
| Parent in couple with children under 15 | Males | 274.0 (4:34) | 14.0 | |
| Parent in couple with youngest child 15 years and over | Females | 264.0 (4:24) | 15.5 | |
| Parent in couple with youngest child 15 years and over | Males | 187.0 (3:07) | 15.4 | |
| Lone parent with children under 15 | Females | 430.0 (7:10) | 38.8 | |
| Lone parent with children under 15 | Males | 339.0 (5:39) | 101.0 | |
| Lone parent with youngest child 15 years and over | Females | 266.0 (4:26) | 28.2 | |
| Lone parent with youngest child 15 years and over | Males | 181.0 (3:01) | 41.9 | |
| In couple with no children | Females | 237.0 (3:57) | 8.4 | |
| In couple with no children | Males | 199.0 (3:19) | 8.6 | |
| Non-dependent child (15 years and over) | Females | 120.0 (2:00) | 19.5 | |
| Non-dependent child (15 years and over) | Males | 100.0 (1:40) | 15.7 | |
| Dependent student 15 to 24 years | Females | 82.0 (1:22) | 14.8 | |
| Dependent student 15 to 24 years | Males | 63.0 (1:03) | 10.4 | |
| Lone person 15 to 64 years | Females | 181.0 (3:01) | 15.6 | |
| Lone person 15 to 64 years | Males | 148.0 (2:28) | 13.9 | |
| Lone person 65 years and over | Females | 261.0 (4:21) | 13.3 | |
| Lone person 65 years and over | Males | 235.0 (3:55) | 14.3 | |
| Other | Females | 179.0 (2:59) | 24.9 | |
| Other | Males | 152.0 (2:32) | 28.0 | |
| Total persons | Females | 263.0 (4:23) | 5.2 | |
| Total persons | Males | 188.0 (3:08) | 5.5 |
Across all people aged 15 and over, females averaged 4:23 of unpaid work a day and males 3:08, a significant gap of 75 minutes [C01]. Males spent 70 minutes more on paid work and study (4:48 against 3:38) [C02]. The gap is widest among partnered parents of children under 15, where female parents averaged 7:27 of unpaid work and male parents 4:34, a difference of 173 minutes [C07].
3. What unpaid work consists of
Unpaid work in the ABS survey has four parts: domestic activities, looking after children aged 14 and under, caring for adults, and volunteering.
Cooking and housework take the most time
Cooking and food or drink preparation and housework each took 0:47 a day on average across everyone aged 15 and over, more than any other domestic task. Cooking was more widespread: 61.6% of people did some on the diary day, against 46.0% for housework [C08]. Table 5 gives participation and time for each task by sex, including shopping, gardening, pet care, household administration and home and vehicle maintenance.
Older Australians spend more time on domestic work
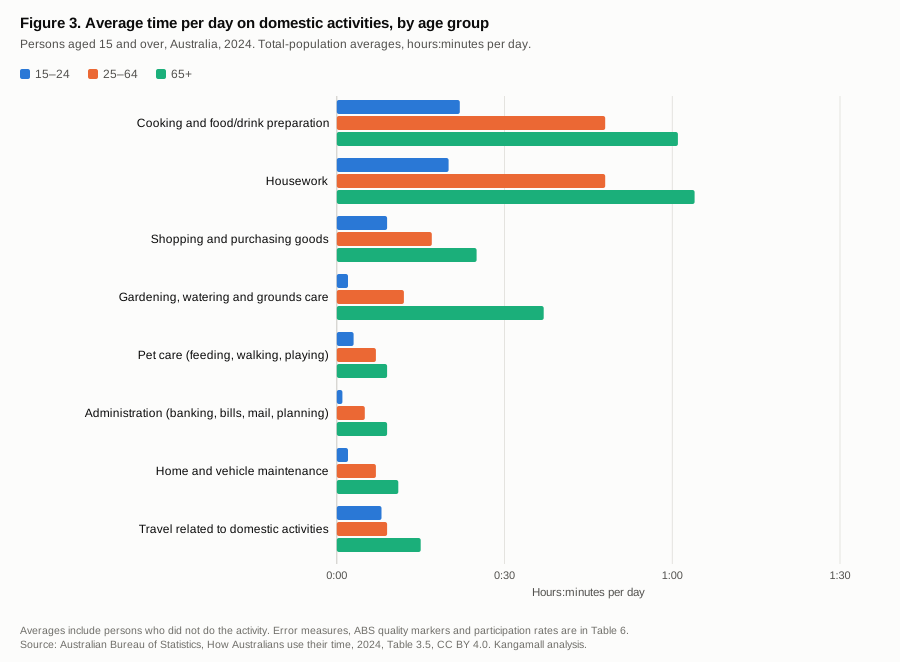
Figure 3. Domestic activities by age group
Hours:minutes per day, total-population averages.Cooking and food/drink preparation
15–240:2225–640:4865+1:01Housework
15–240:2025–640:4865+1:04Shopping and purchasing goods
15–240:0925–640:1765+0:25Gardening, watering and grounds care
15–240:02*25–640:1265+0:37Pet care (feeding, walking, playing)
15–240:0325–640:0765+0:09Administration (banking, bills, mail, planning)
15–240:0125–640:0565+0:09Home and vehicle maintenance
15–240:02*25–640:0765+0:11Travel related to domestic activities
15–240:0825–640:0965+0:15
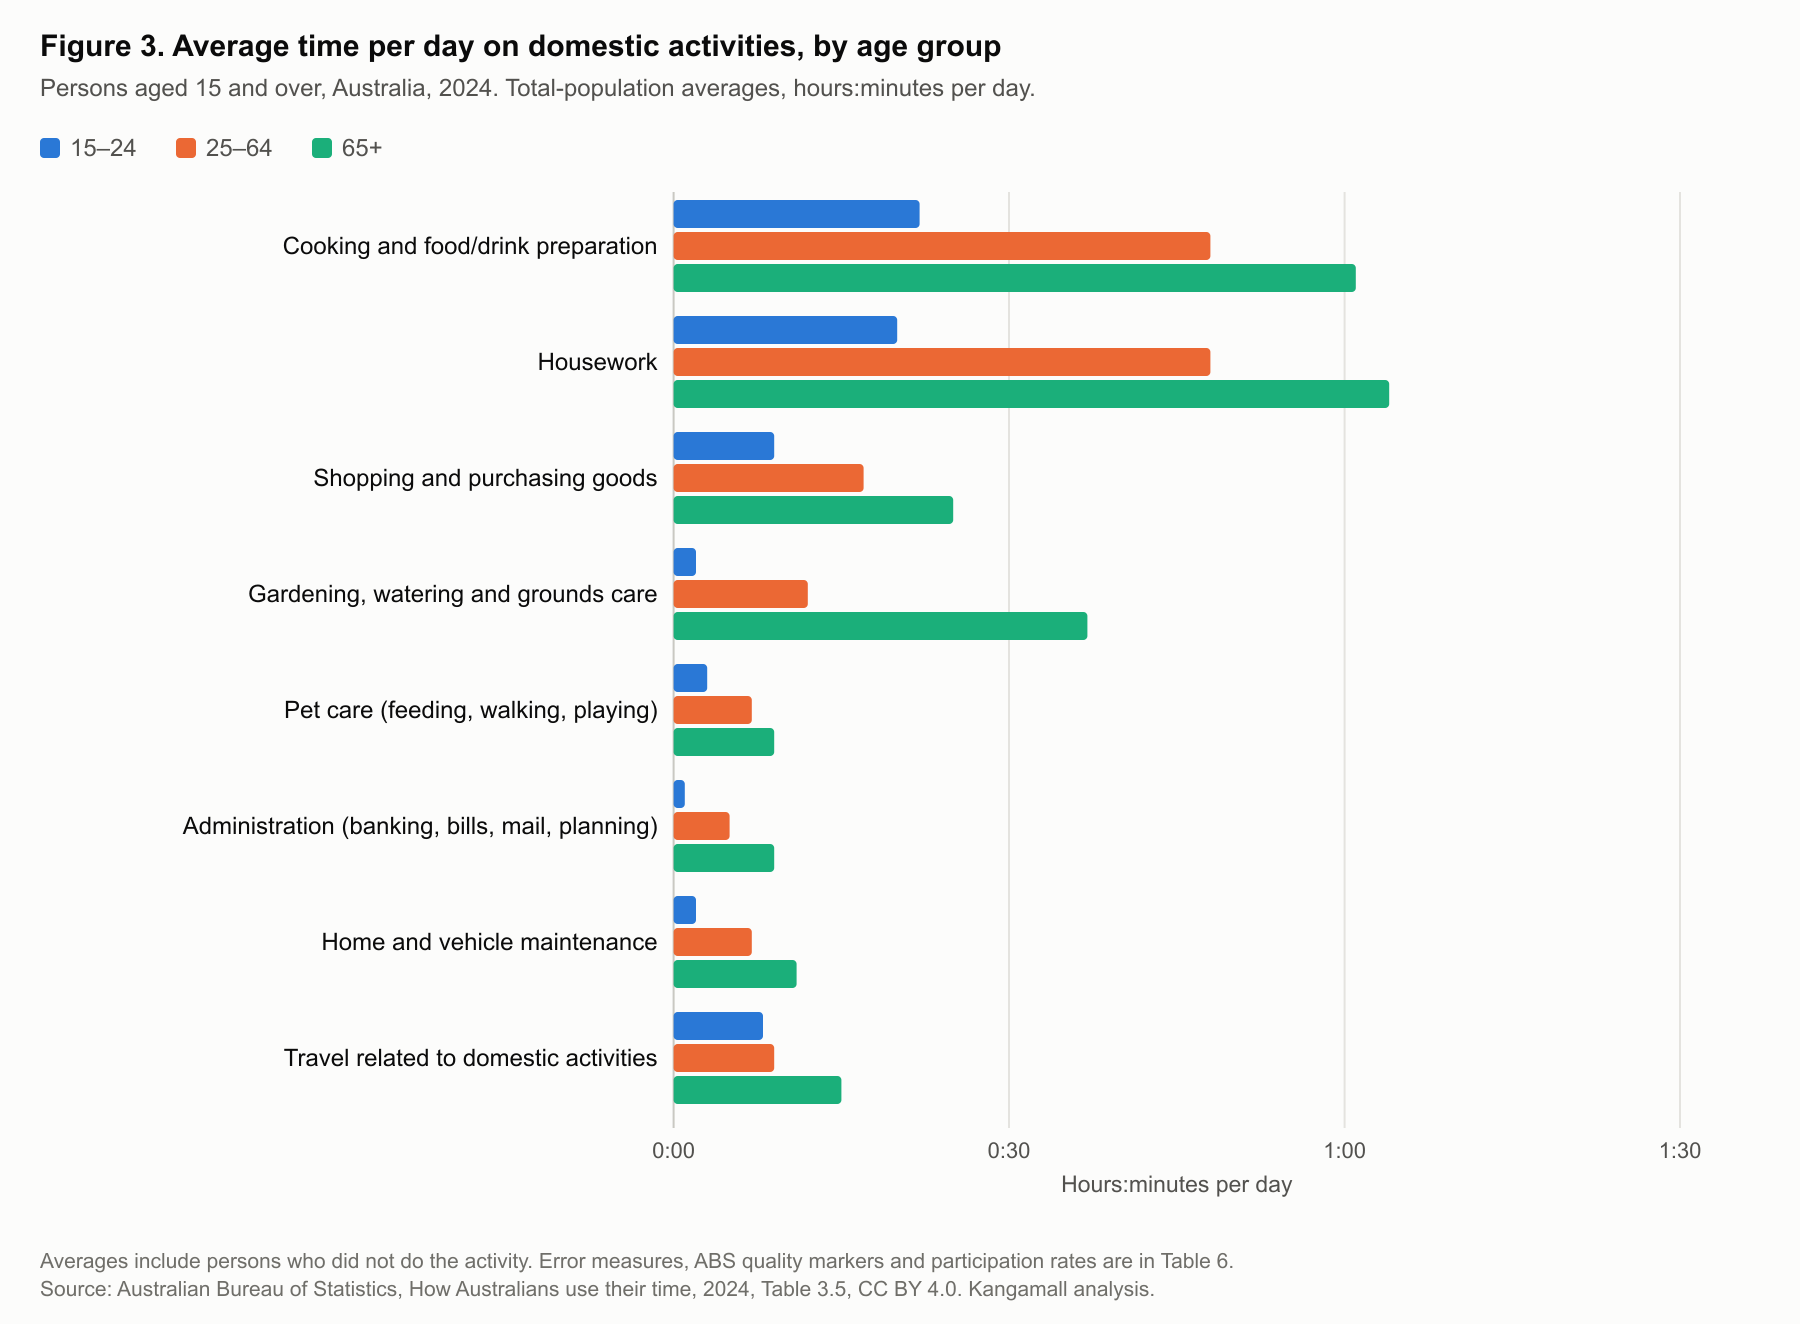
View Figure 3 data as a table
| activity | age group | minutes per day | abs quality flag |
|---|---|---|---|
| Cooking and food/drink preparation | 15–24 | 22.0 (0:22) | |
| Cooking and food/drink preparation | 25–64 | 48.0 (0:48) | |
| Cooking and food/drink preparation | 65+ | 61.0 (1:01) | |
| Housework | 15–24 | 20.0 (0:20) | |
| Housework | 25–64 | 48.0 (0:48) | |
| Housework | 65+ | 64.0 (1:04) | |
| Shopping and purchasing goods | 15–24 | 9.0 (0:09) | |
| Shopping and purchasing goods | 25–64 | 17.0 (0:17) | |
| Shopping and purchasing goods | 65+ | 25.0 (0:25) | |
| Gardening, watering and grounds care | 15–24 | 2.0 (0:02) | caution_rse_25_to_50 |
| Gardening, watering and grounds care | 25–64 | 12.0 (0:12) | |
| Gardening, watering and grounds care | 65+ | 37.0 (0:37) | |
| Pet care (feeding, walking, playing) | 15–24 | 3.0 (0:03) | |
| Pet care (feeding, walking, playing) | 25–64 | 7.0 (0:07) | |
| Pet care (feeding, walking, playing) | 65+ | 9.0 (0:09) | |
| Administration (banking, bills, mail, planning) | 15–24 | 1.0 (0:01) | |
| Administration (banking, bills, mail, planning) | 25–64 | 5.0 (0:05) | |
| Administration (banking, bills, mail, planning) | 65+ | 9.0 (0:09) | |
| Home and vehicle maintenance | 15–24 | 2.0 (0:02) | caution_rse_25_to_50 |
| Home and vehicle maintenance | 25–64 | 7.0 (0:07) | |
| Home and vehicle maintenance | 65+ | 11.0 (0:11) | |
| Travel related to domestic activities | 15–24 | 8.0 (0:08) | |
| Travel related to domestic activities | 25–64 | 9.0 (0:09) | |
| Travel related to domestic activities | 65+ | 15.0 (0:15) |
People aged 65 and over averaged 3:53 a day on domestic activities, against 2:34 for people aged 25–64, a significant difference of 79 minutes [C09].
Childcare time falls as children grow
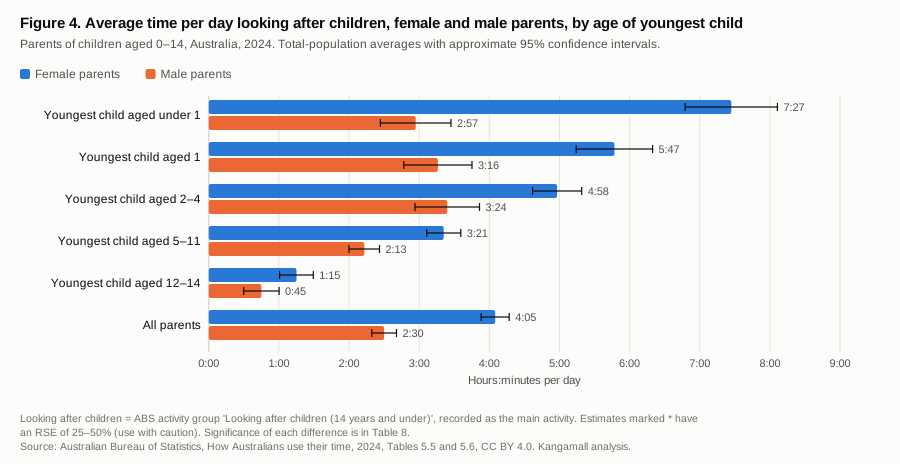
Figure 4. Childcare, female and male parents
Hours:minutes per day, total-population averages.Under 1
Female parents7:27Male parents2:571
Female parents5:47Male parents3:162–4
Female parents4:58Male parents3:245–11
Female parents3:21Male parents2:1312–14
Female parents1:15Male parents0:45All parents
Female parents4:05Male parents2:30
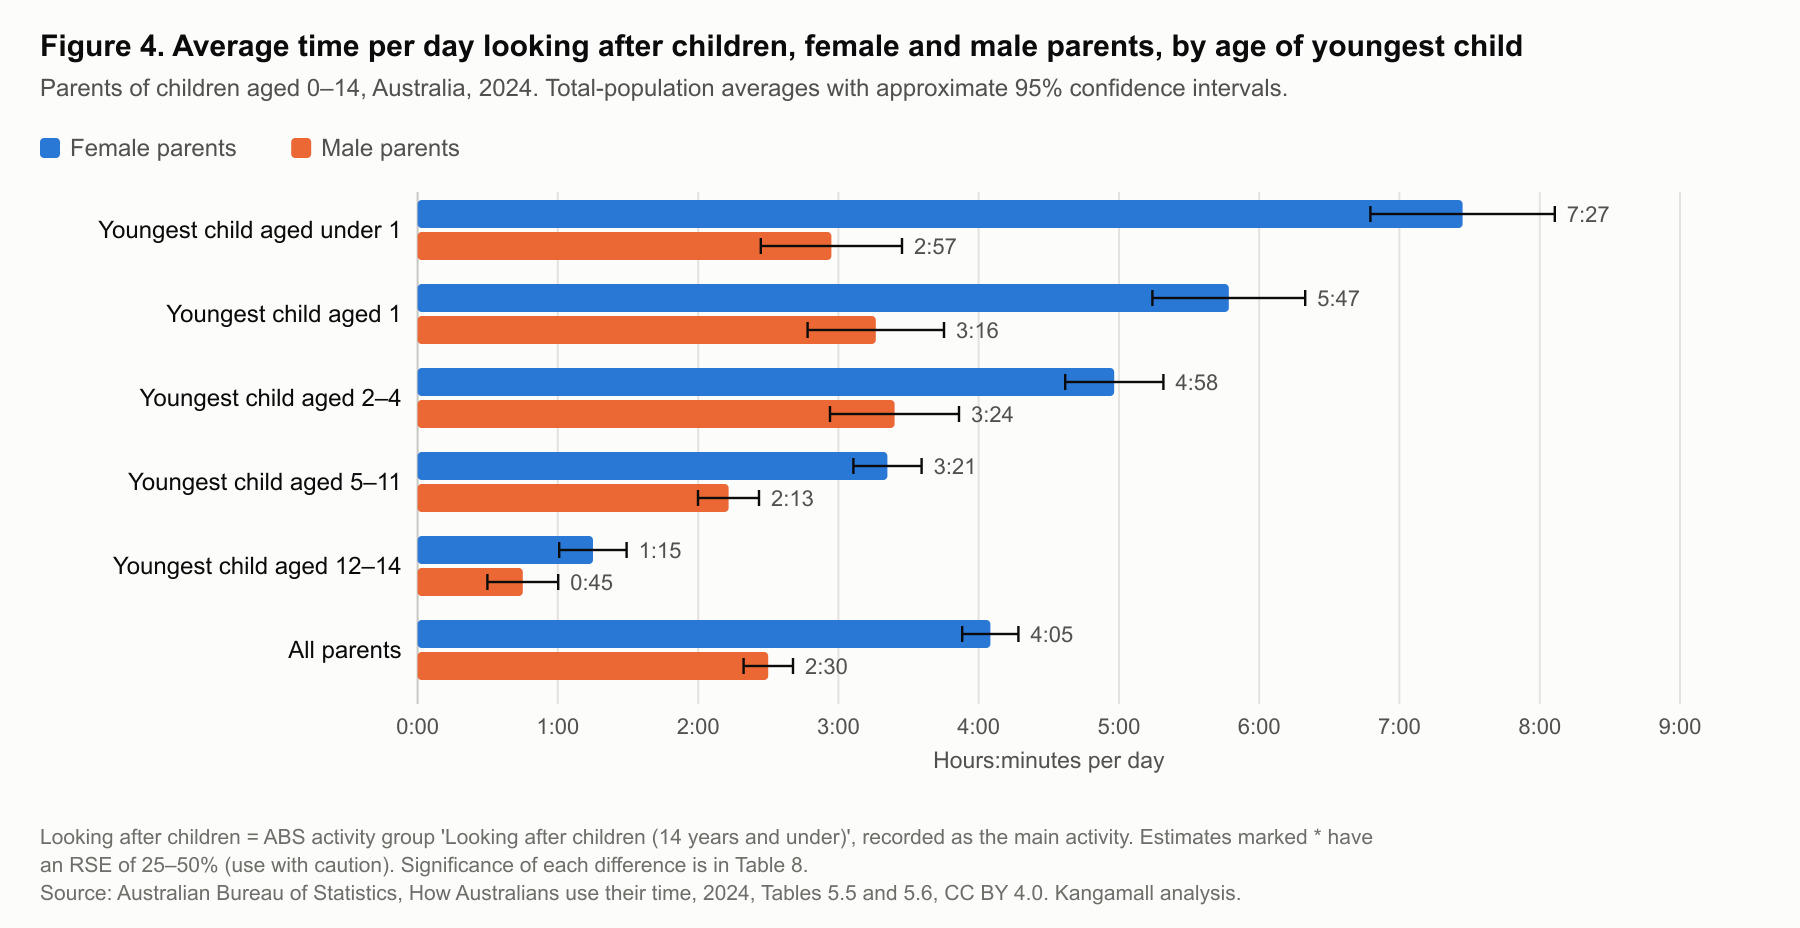
View Figure 4 data as a table
| youngest child age | parent | minutes per day | ci95 half width minutes | abs quality flag |
|---|---|---|---|---|
| Under 1 | Female parents | 447.0 (7:27) | 39.4 | |
| Under 1 | Male parents | 177.0 (2:57) | 30.2 | |
| 1 | Female parents | 347.0 (5:47) | 32.6 | |
| 1 | Male parents | 196.0 (3:16) | 29.2 | |
| 2–4 | Female parents | 298.0 (4:58) | 21.0 | |
| 2–4 | Male parents | 204.0 (3:24) | 27.6 | |
| 5–11 | Female parents | 201.0 (3:21) | 14.6 | |
| 5–11 | Male parents | 133.0 (2:13) | 13.0 | |
| 12–14 | Female parents | 75.0 (1:15) | 14.4 | |
| 12–14 | Male parents | 45.0 (0:45) | 15.2 | |
| All parents | Female parents | 245.0 (4:05) | 12.0 | |
| All parents | Male parents | 150.0 (2:30) | 10.6 |
Parents whose youngest child was under 1 averaged 5:17 a day looking after children as their main activity; parents whose youngest child was 12–14 averaged 1:02 [C10]. With a child under 1, female parents averaged 7:27 a day and male parents 2:57, a difference of 270 minutes [C11]. This figure covers all children aged 0–14 in those households and is a different measure from the 7:27 of total unpaid work in Section 2 [C07]. Female parents spent significantly more time on childcare than male parents at every age of youngest child [C17]. Supervising children while doing something else is recorded separately by ABS and is not included here.
4. Who feels rushed, and why
One in three often feels rushed
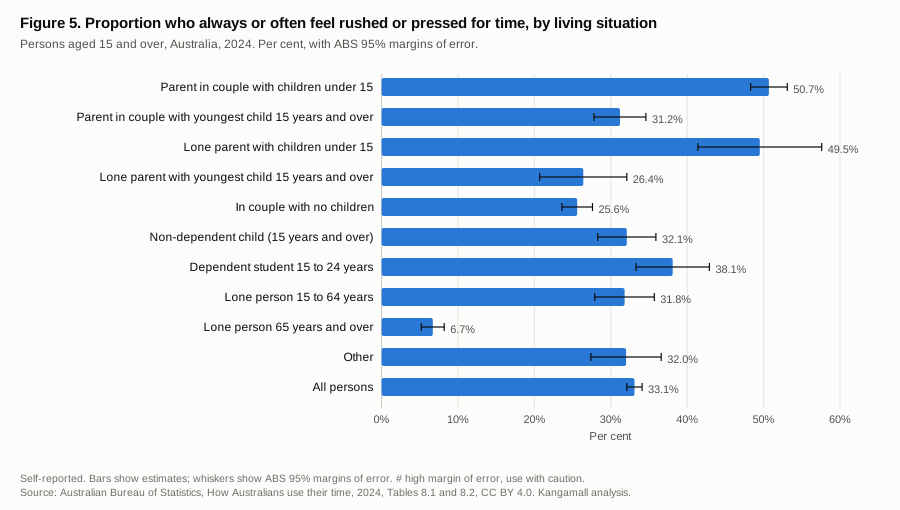
Figure 5. Feeling rushed, by living situation
Per cent. ABS 95% margins of error are in the table below.- Parent in couple with children under 1550.7%
- Parent in couple with youngest child 15 years and over31.2%
- Lone parent with children under 1549.5%
- Lone parent with youngest child 15 years and over26.4%
- In couple with no children25.6%
- Non-dependent child (15 years and over)32.1%
- Dependent student 15 to 24 years38.1%
- Lone person 15 to 64 years31.8%
- Lone person 65 years and over6.7%
- Other32.0%
- All persons33.1%
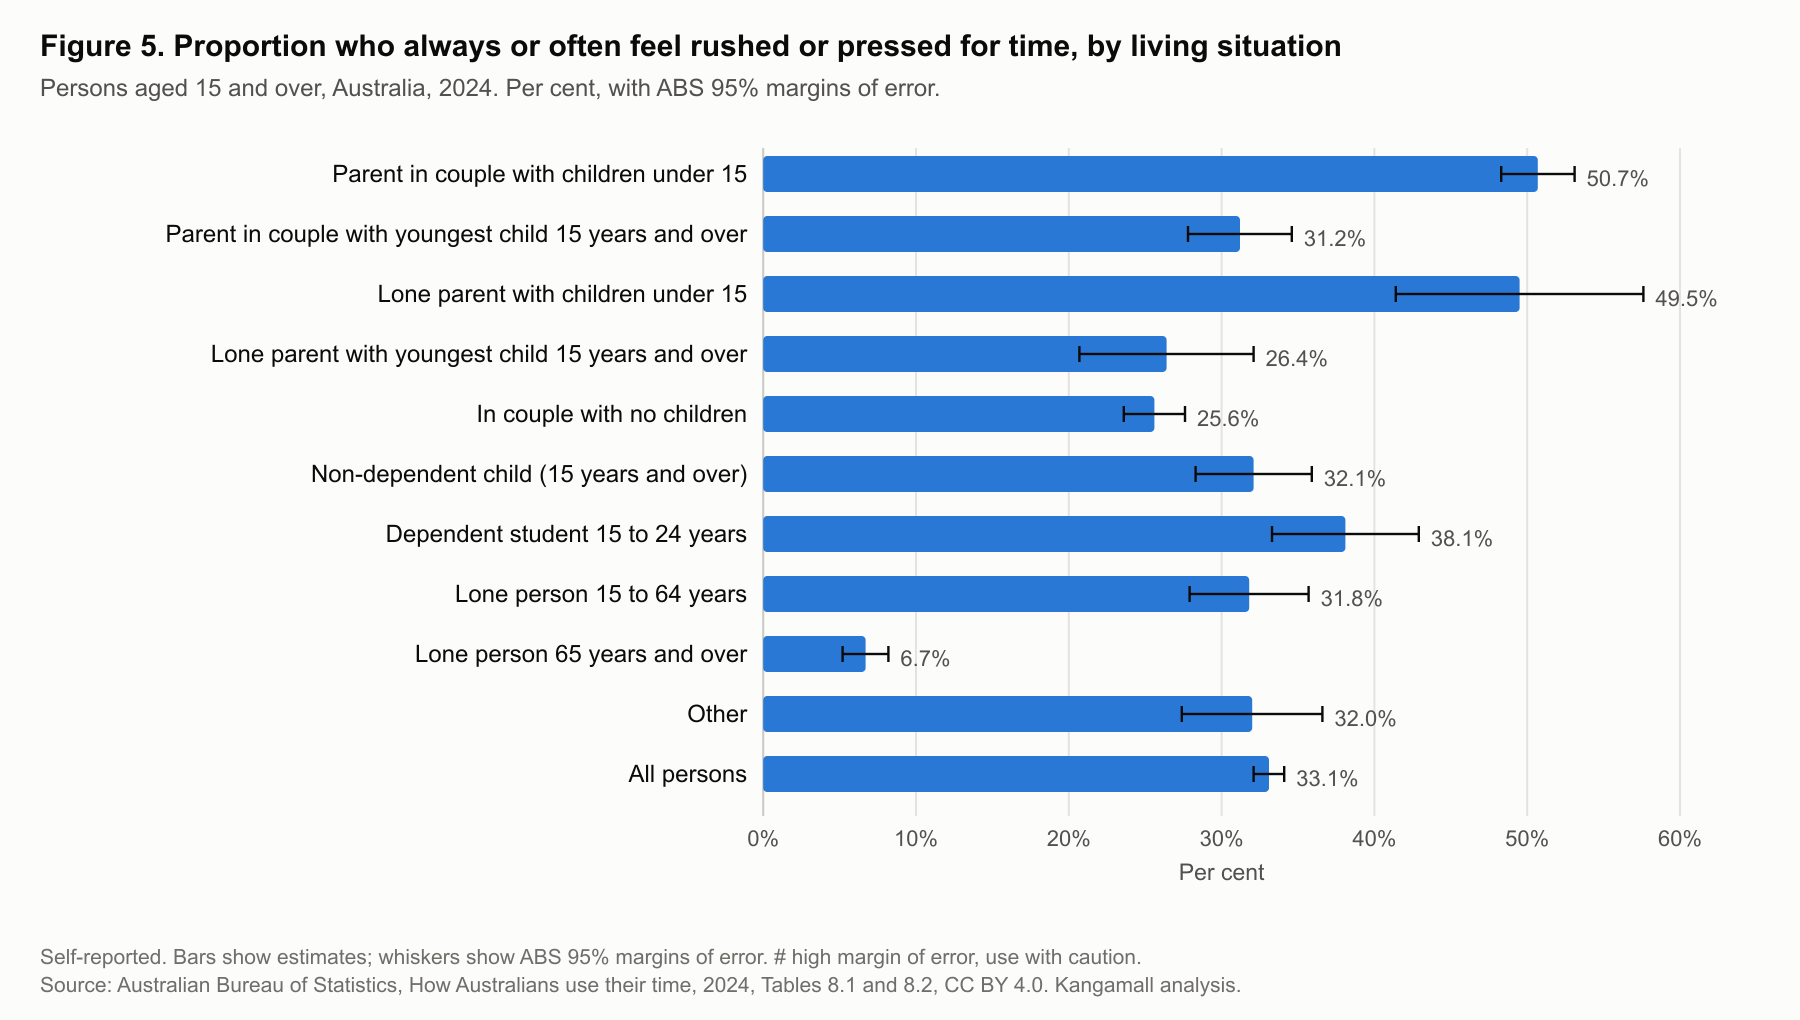
View Figure 5 data as a table
| living situation | per cent | moe 95 pct points | abs quality flag |
|---|---|---|---|
| Parent in couple with children under 15 | 50.7 | 2.4 | |
| Parent in couple with youngest child 15 years and over | 31.2 | 3.4 | |
| Lone parent with children under 15 | 49.5 | 8.1 | |
| Lone parent with youngest child 15 years and over | 26.4 | 5.7 | |
| In couple with no children | 25.6 | 2 | |
| Non-dependent child (15 years and over) | 32.1 | 3.8 | |
| Dependent student 15 to 24 years | 38.1 | 4.8 | |
| Lone person 15 to 64 years | 31.8 | 3.9 | |
| Lone person 65 years and over | 6.7 | 1.5 | |
| Other | 32.0 | 4.6 | |
| All persons | 33.1 | 1 |
33.1% of people aged 15 and over always or often feel rushed or pressed for time: 36.4% of females and 29.6% of males, a statistically significant difference [C12]. Partnered parents with children under 15 reported it most often (50.7%), not significantly different from lone parents of children under 15 (49.5%); people aged 65 and over living alone reported it least (6.7%) [C13].
Workers and carers are more likely to feel rushed
41.8% of people employed full-time and 39.1% of those employed part-time always or often feel rushed, against 17.3% of people not in the labour force [C14]. The full-time and part-time figures are close; the gap between them only just reaches statistical significance and would not survive an adjustment for multiple comparisons. People not in the labour force are older on average, and Table 9 shows feeling rushed falls sharply with age, so the gap does not isolate the effect of work. Among people who had cared for someone with a long-term health condition, disability or age-related need in the previous four weeks, 37.6% felt rushed, against 32.4% of those who had not [C15].
What people say makes them feel rushed
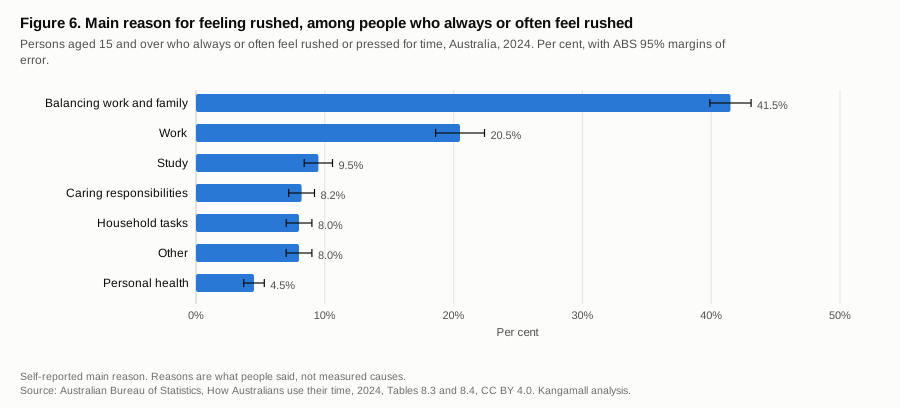
Figure 6. Main reason for feeling rushed
Per cent. ABS 95% margins of error are in the table below.- Balancing work and family41.5%
- Work20.5%
- Study9.5%
- Caring responsibilities8.2%
- Household tasks8.0%
- Other8.0%
- Personal health4.5%
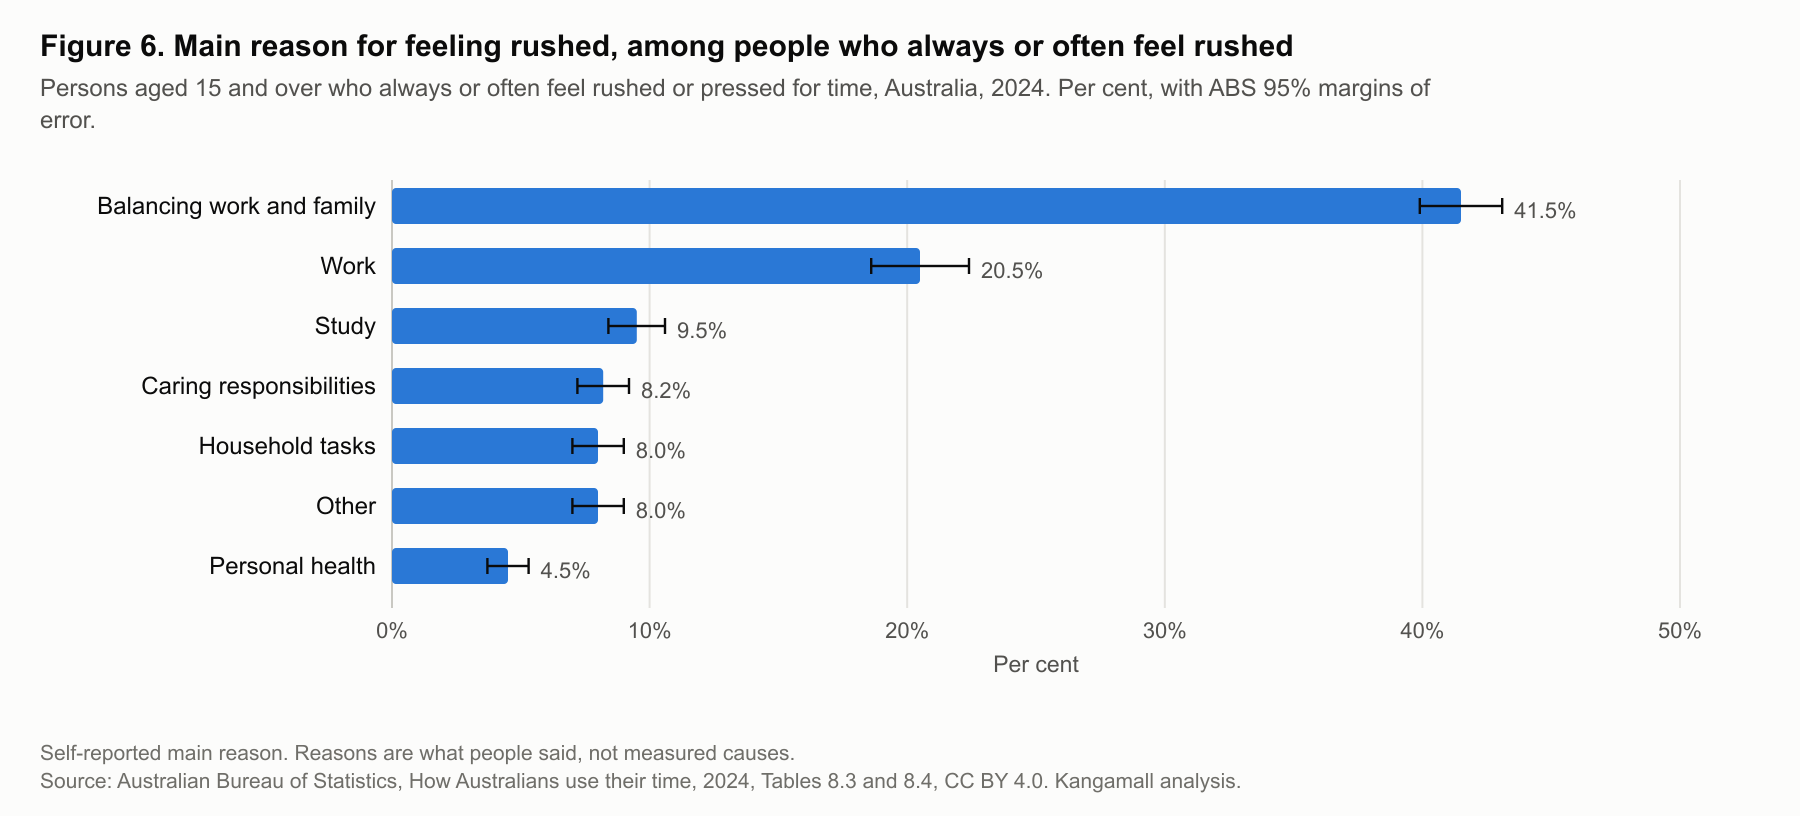
View Figure 6 data as a table
| reason | per cent | moe 95 pct points | abs quality flag |
|---|---|---|---|
| Balancing work and family | 41.5 | 1.6 | |
| Work | 20.5 | 1.9 | |
| Study | 9.5 | 1.1 | |
| Caring responsibilities | 8.2 | 1 | |
| Household tasks | 8.0 | 1 | |
| Other | 8.0 | 1 | |
| Personal health | 4.5 | 0.8 |
Balancing work and family was the main reason given by 41.5% of people who always or often feel rushed, and work by 20.5% [C16]. These are the reasons people reported, not measured causes.
5. The full working day
ABS publishes paid work and study and unpaid work separately. Total-population averages can be added, so we combine them into a full working day, averaged over all seven days of the week. ABS does not publish these totals; they are Kangamall calculations from the ABS estimates. Only main activities are counted, so childcare done alongside another activity is not included.
Similar totals, different mix
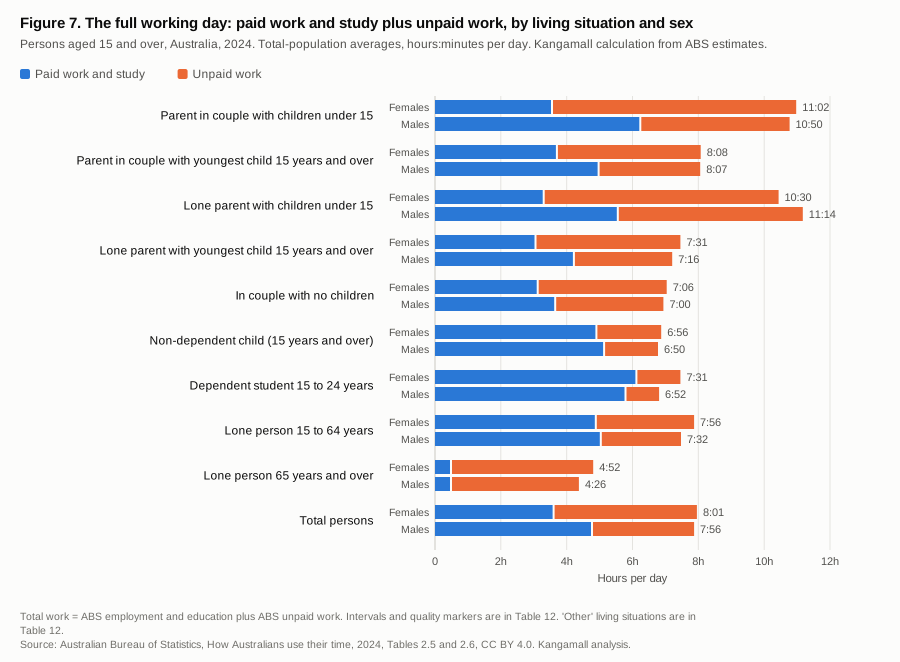
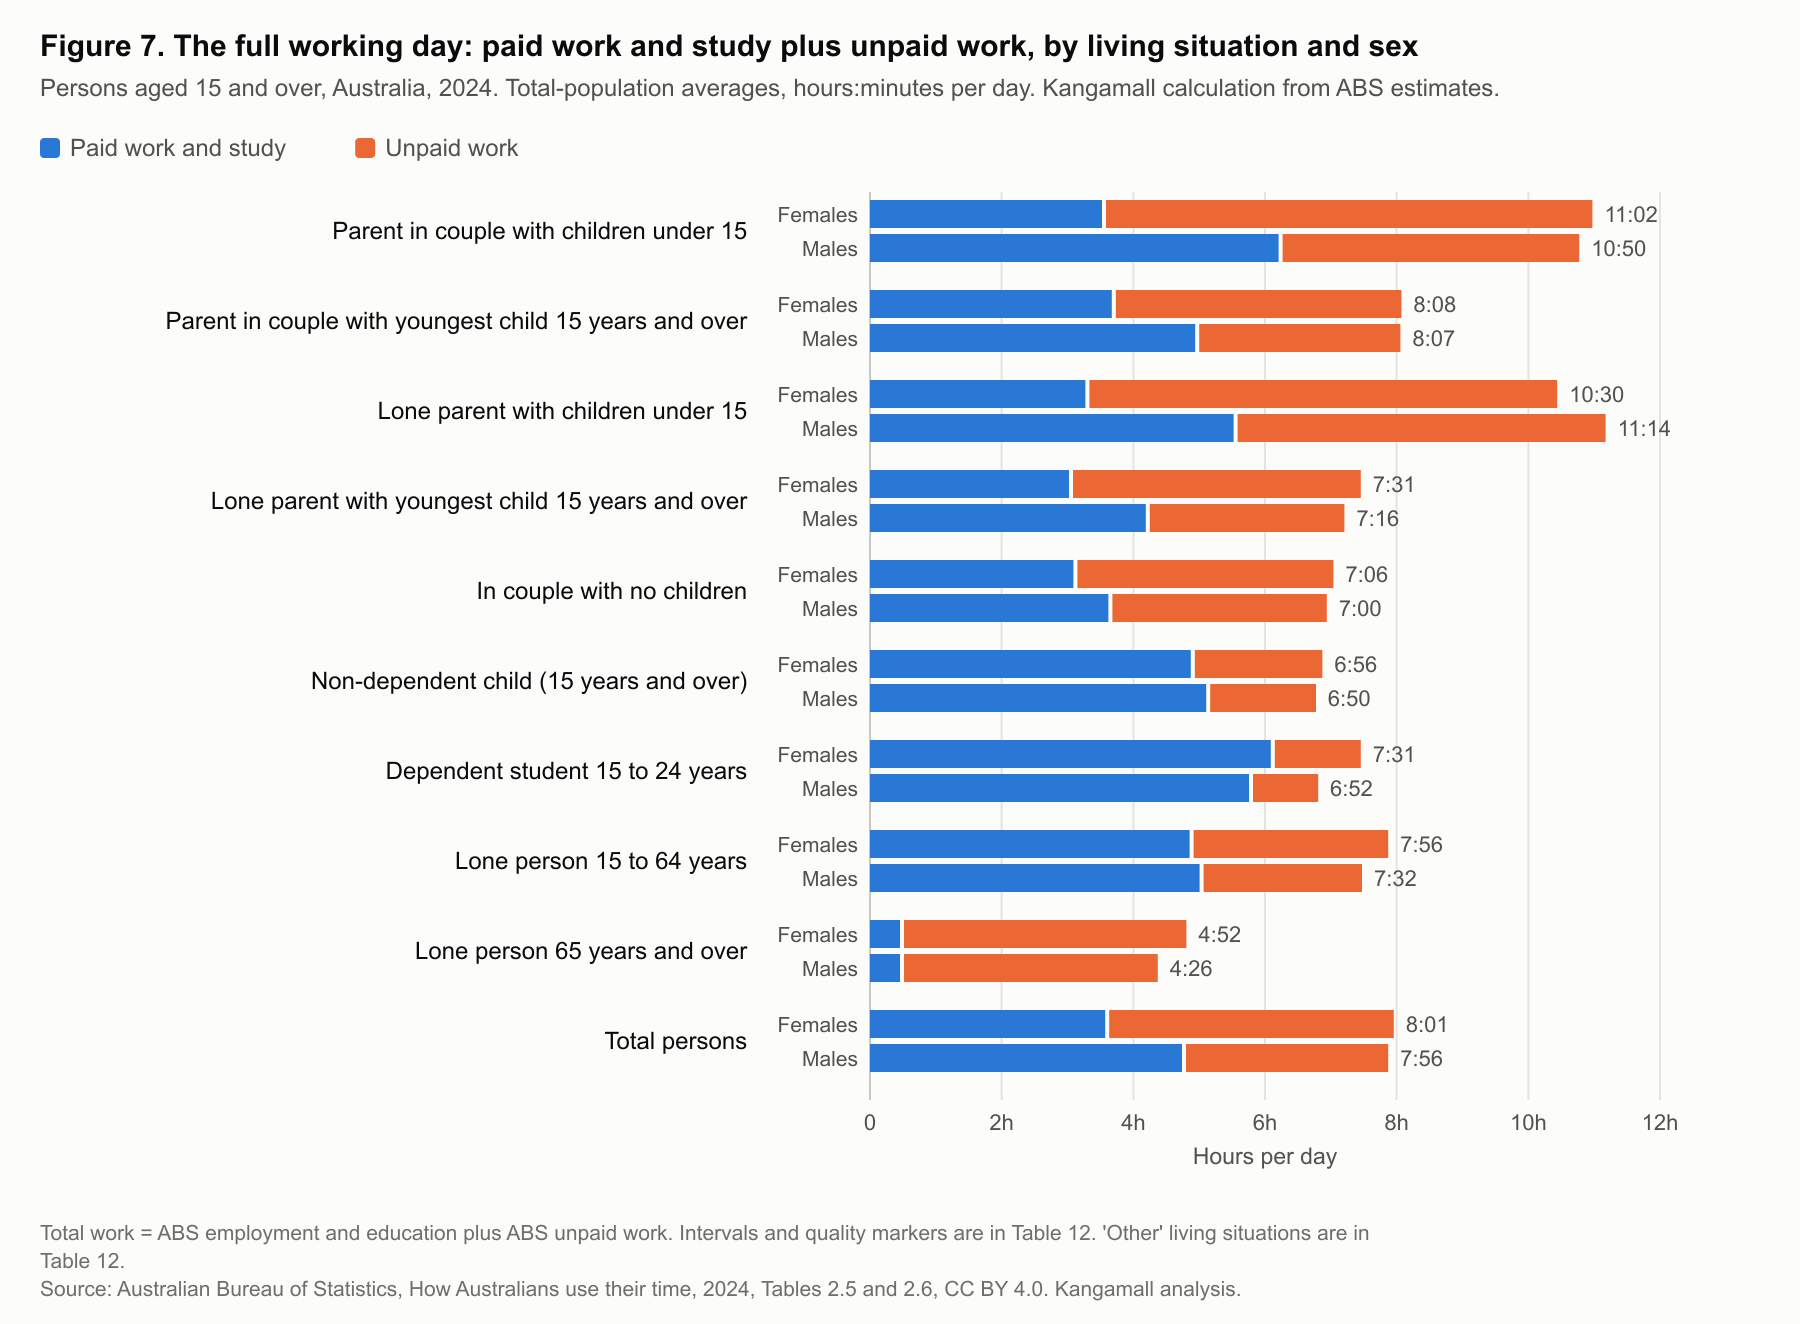
Figure 7. The full working day, females and males
Hours:minutes per day, total-population averages.Parent in couple with children under 15
Females11:02Males10:50Parent in couple with youngest child 15 years and over
Females8:08Males8:07Lone parent with children under 15
Females10:30Males11:14Lone parent with youngest child 15 years and over
Females7:31Males7:16In couple with no children
Females7:06Males7:00Non-dependent child (15 years and over)
Females6:56Males6:50Dependent student 15 to 24 years
Females7:31Males6:52Lone person 15 to 64 years
Females7:56Males7:32Lone person 65 years and over
Females4:52Males4:26Total persons
Females8:01Males7:56
View Figure 7 data as a table
| living situation | sex | minutes per day | paid work and study minutes | unpaid work minutes | ci95 half width minutes | abs quality flag |
|---|---|---|---|---|---|---|
| Parent in couple with children under 15 | Females | 662.0 (11:02) | 215.0 | 447.0 | 21.9 | |
| Parent in couple with children under 15 | Males | 650.0 (10:50) | 376.0 | 274.0 | 20.3 | |
| Parent in couple with youngest child 15 years and over | Females | 488.0 (8:08) | 224.0 | 264.0 | 29.1 | |
| Parent in couple with youngest child 15 years and over | Males | 487.0 (8:07) | 300.0 | 187.0 | 31.1 | |
| Lone parent with children under 15 | Females | 630.0 (10:30) | 200.0 | 430.0 | 58.9 | |
| Lone parent with children under 15 | Males | 674.0 (11:14) | 335.0 | 339.0 | 147.6 | |
| Lone parent with youngest child 15 years and over | Females | 451.0 (7:31) | 185.0 | 266.0 | 47.6 | |
| Lone parent with youngest child 15 years and over | Males | 436.0 (7:16) | 255.0 | 181.0 | 94.3 | |
| In couple with no children | Females | 426.0 (7:06) | 189.0 | 237.0 | 14.8 | |
| In couple with no children | Males | 420.0 (7:00) | 221.0 | 199.0 | 16.7 | |
| Non-dependent child (15 years and over) | Females | 416.0 (6:56) | 296.0 | 120.0 | 47.2 | |
| Non-dependent child (15 years and over) | Males | 410.0 (6:50) | 310.0 | 100.0 | 36.4 | |
| Dependent student 15 to 24 years | Females | 451.0 (7:31) | 369.0 | 82.0 | 25.1 | |
| Dependent student 15 to 24 years | Males | 412.0 (6:52) | 349.0 | 63.0 | 29.3 | |
| Lone person 15 to 64 years | Females | 476.0 (7:56) | 295.0 | 181.0 | 31.8 | |
| Lone person 15 to 64 years | Males | 452.0 (7:32) | 304.0 | 148.0 | 30.2 | |
| Lone person 65 years and over | Females | 292.0 (4:52) | 31.0 | 261.0 | 16.5 | |
| Lone person 65 years and over | Males | 266.0 (4:26) | 31.0 | 235.0 | 19.6 | |
| Total persons | Females | 481.0 (8:01) | 218.0 | 263.0 | 7.9 | |
| Total persons | Males | 476.0 (7:56) | 288.0 | 188.0 | 9.2 |
Females aged 15 and over averaged 8:01 of combined work a day (3:38 of paid work and study and 4:23 unpaid) and males 7:56 (4:48 and 3:08). The 5-minute gap is not statistically significant. Unpaid work made up 55% of the female total and 39% of the male total [C20].
Parents of young children work the longest days
Partnered parents with children under 15 put in 10:56 of combined work a day (4:58 paid work and study, 5:58 unpaid), 178 minutes more than the 7:58 average for all people aged 15 and over (4:12 and 3:46). Lone parents with children under 15 averaged 10:38 (3:43 and 6:55), not significantly different [C21]. Within partnered parents, female parents averaged 11:02 (3:35 and 7:27) and male parents 10:50 (6:16 and 4:34); the totals are not significantly different, but 68% of the female parents' time was unpaid against 42% for male parents [C22].
6. What these data cannot tell us
The survey records how people spend their time. Several questions that matter for household decisions are outside its reach (Table 11):
- Households as a whole. Estimates are for individuals. A couple's combined time, or how tasks are shared in a particular household, cannot be read from these tables.
- Places. Results are national. Apart from broad remoteness areas, there are no state, city or local estimates.
- Detailed tasks by life stage. Detailed tasks are published by sex, age group, age of youngest child, parents' labour force status, and disability, carer and volunteer status, but not by living situation.
- Change over time. ABS states the 2024 survey is not fully comparable with earlier collections, so this report does not describe trends.
- Choices and willingness to pay. Time spent cooking, cleaning or caring does not show whether people want help, can find it locally or would pay for it.
Method, limits and how to use this report
Data. All estimates come from the ABS 2024 Time Use Survey data cubes, Tables 1–14: Tables 1–10 were first released on 17 December 2025, and Tables 11–14 were added and Table 8 reissued with additional data on 5 August 2026. The survey covered usual residents aged 15 and over in private dwellings, excluding very remote areas and discrete Aboriginal and Torres Strait Islander communities. The achieved sample was 6,899 households, 10,613 people and 19,319 diary days, collected from 22 July to 3 September and 16 September to 29 October 2024. Respondents recorded their activities in 5-minute intervals in an online diary over two consecutive days, or by telephone for one day. [T01]
Measures. Unless stated otherwise, times are ABS total-population averages: the average across everyone in a group, including people who did not do the activity on the diary day. They can be compared across groups and added across activities, which is how Section 5 combines paid work and study with unpaid work. ABS participant averages count only people who did an activity and are higher; they are the figures in ABS's own headlines, which report 4:53 of unpaid work a day for females and 3:52 for males among people who did some, against 4:23 and 3:08 across all people [C19]. Participant averages appear in Tables 5 and 6 with participation rates. Times are shown as hours:minutes per day. ABS uses "females" and "males" for sex recorded at birth, and this report does the same.
Reliability and significance. Every estimate keeps its ABS relative standard error or 95% margin of error. Times with a relative standard error of 25–50% are marked * and those above 50% are marked ** and not used for conclusions; proportions with a high margin of error are marked #. Differences are described as statistically significant when the difference divided by its approximate standard error, √(SE₁² + SE₂²), exceeds 1.96, following the ABS method. [M01] For combined totals, the standard error of each total is approximated in the same way from its two components. Only separate groups are tested. Tests are not adjusted for multiple comparisons: the findings rest on 25 distinct comparisons, and Tables 4 and 8 report further tests, so a small number of 'significant' results could arise by chance. Shares within the same group of respondents (reasons for feeling rushed) are not tested.
Data correction. In the published ABS Table 2.1, the female rows for equivalised household income quintiles are printed one row above their labels. Kangamall realigned these 55 values after confirming each population estimate against ABS Table 2.3, and flagged them in the data. They are not used in this report's findings.
Limits. This is a secondary analysis of published estimates with no new data collection. Estimates describe individuals, not households; living situation describes a person's position in a household, and groups differ in age and sex composition. ABS randomly adjusts table cells to protect confidentiality, so components may not sum exactly to totals. Reasons for feeling rushed are self-reported.
Reuse. The full restructured dataset (all 25,110 published values with error measures and source cells), the scripts that produce every table and figure, and the claim register are published with this report. When reusing figures or findings, please credit "Kangamall analysis of Australian Bureau of Statistics data" and link to https://kangamall.au/research/australias-24-hours/. ABS statistics remain attributed to the ABS; no ABS endorsement is implied. Reuse terms for the charts are in REUSE.txt.
Data and references
Detailed tables · Claim register · Claim number check · Report number trace · Restructured dataset · Methods and data dictionary · Reproduce the analysis · Analysis scripts
- T01: Australian Bureau of Statistics. (2025). How Australians use their time, 2024 [Data cubes TUSDC01–TUSDC14; Tables 11–14 added and Table 8 reissued 5 August 2026]. Accessed 27 October 2026.
- M01: Australian Bureau of Statistics. (2025). How Australians use their time methodology, 2024. Accessed 28 October 2026.
ABS material is used under the Creative Commons Attribution 4.0 International licence. Kangamall Research reviewed and edited this report and is responsible for its content. AI-assisted tools were used for data processing, calculation checks and drafting. Every number is generated by script from the ABS files and traced in the claim register, and every claim was recalculated from the original ABS files before publication. The report has not been externally peer reviewed. The study has no sponsor or commercial partner; Kangamall is developing local service information, and no business paid for or influenced this research.
Corrections
- Version 1.2.0, 6 November 2026. Added Section 5, "The full working day" (Table 12, Figure 7 and claims C20–C22), a Kangamall calculation combining ABS paid and unpaid work estimates. Revised the text for clarity and removed the section "Using these findings". Existing figures, tables and claims are unchanged.
- Version 1.1.1, 6 November 2026. Reviewed and edited by Kangamall Research; the note on how the report was produced was revised. No data, calculations or findings changed.
- Version 1.1.0, 31 October 2026. Renamed from "Australia's 24 hours: how work and study, housework, care and free time are shared across life stages" to "Australian Time Use Report 2026: How Australians spend their 24 hours". Added a summary, at-a-glance figures and headed key findings. No data, calculations or findings changed. The version 1.0.0 package remains available at https://kangamall.au/research/australias-24-hours/downloads/v1.0.0/kangamall-australias-24-hours-v1.0.0.zip.
- Version 1.0.0, 31 October 2026. First publication.
EVERY NUMBER, TRACED
Claim register
Each bracketed reference in the report points to a row below. The ABS cells can be checked in the original data cubes; the register is also available as a CSV file. Review: Reviewed and edited by Kangamall Research. Every number was recalculated from the original ABS files.
| ID | Claim | ABS source cells | Calculation |
|---|---|---|---|
| C01 | On average, females aged 15 and over spent 4:23 a day on unpaid work and males 3:08, a difference of 75 minutes (statistically significant at 95%). | Table 2.5!J155; Table 2.5!J81 | ABS SE-of-difference test |
| C02 | On average, males spent 4:48 a day on employment and education and females 3:38, a difference of 70 minutes (statistically significant). | Table 2.5!E155; Table 2.5!E81 | ABS SE-of-difference test |
| C03 | Of the living situations shown, 'Lone parent with children under 15' had the highest average unpaid work (6:55 a day); the gap to the next highest, 'Parent in couple with children under 15' (5:58), is statistically significant. | Table 2.5!J206; Table 2.5!J204 | ranking of point estimates; ABS SE-of-difference test between first and second |
| C04 | Lone parents with children under 15 averaged 6:55 a day on unpaid work, compared with 5:58 for parents in couples with children under 15 (statistically significant difference of 57 minutes). | Table 2.5!J206; Table 2.5!J204 | ABS SE-of-difference test |
| C05 | Lone parents with children under 15 averaged 3:43 a day on employment and education, compared with 4:58 for parents in couples with children under 15 (statistically significant difference of 75 minutes). | Table 2.5!E206; Table 2.5!E204 | ABS SE-of-difference test |
| C06 | Average free time ranged from 2:58 a day for 'Parent in couple with children under 15' to 7:34 for 'Lone person 65 years and over' (statistically significant difference). The lowest was not statistically different from the next lowest, 'Lone parent with children under 15' (3:03). | Table 2.5!K204; Table 2.5!K206; Table 2.5!K212 | minimum, second-lowest and maximum point estimates; ABS SE-of-difference test (lowest vs highest, lowest vs second-lowest) |
| C07 | Among parents in couples with children under 15, female parents averaged 7:27 of unpaid work a day and male parents 4:34 (statistically significant difference of 173 minutes). | Table 2.5!J130; Table 2.5!J56 | ABS SE-of-difference test |
| C18 | About 84% of lone parents with children under 15 were female, compared with about 49% of parents in couples with children under 15. Comparing females only, lone parents averaged 7:10 of unpaid work a day and partnered parents 7:27 (not statistically significant difference), and 3:20 and 3:35 on employment and education (not statistically significant difference). | Table 2.5!L132; Table 2.5!L206; Table 2.5!L130; Table 2.5!L204; Table 2.5!J132; Table 2.5!J130; Table 2.5!E132; Table 2.5!E130 | derived: female share = female population / persons population (Table 2.5 'Total population' column, thousands); ABS SE-of-difference test for the two female-only comparisons |
| C19 | The ABS headline averages of 4:53 a day of unpaid work for females and 3:52 for males are averages among people who did some unpaid work on the diary day; across all people aged 15 and over the averages are 4:23 and 3:08. | Table 1.1!F22; Table 1.1!E22; Table 2.5!J155; Table 2.5!J81 | comparison of ABS participant averages (Table 1.1) with total-population averages (Table 2.5) |
| C08 | Among domestic activities, 'Cooking and food/drink preparation' and 'Housework' took the most time on average, each 0:47 a day across all persons aged 15 and over. 61.6% did cooking and food/drink preparation on the diary day; 46.0% did housework on the diary day. | Table 1.1!J24; Table 1.1!D24; Table 1.1!J25; Table 1.1!D25 | ranking of total-population point estimates; equal published values reported as a tie |
| C09 | People aged 65 and over averaged 3:53 a day on domestic activities, compared with 2:34 for people aged 25–64 (statistically significant difference of 79 minutes). | Table 3.5!M23; Table 3.5!G23 | ABS SE-of-difference test |
| C10 | Parents whose youngest child was under 1 averaged 5:17 a day looking after children as their main activity, compared with 1:02 for parents whose youngest child was 12–14 (statistically significant). | Table 5.5!D30; Table 5.5!P30 | ABS SE-of-difference test |
| C11 | Where the youngest child was under 1, female parents averaged 7:27 a day looking after children as their main activity and male parents 2:57 (statistically significant difference of 270 minutes; about 2.5 times as long). | Table 5.5!C30; Table 5.5!B30 | ABS SE-of-difference test |
| C17 | Female parents spent significantly more time than male parents looking after children as their main activity for every age group of youngest child shown (under 1, 1, 2–4, 5–11 and 12–14). | Table 5.5!C30; Table 5.5!B30; Table 5.5!F30; Table 5.5!E30; Table 5.5!I30; Table 5.5!H30; Table 5.5!L30; Table 5.5!K30; Table 5.5!O30; Table 5.5!N30 | ABS SE-of-difference test for each of five age groups |
| C12 | 33.1% of people aged 15 and over said they always or often feel rushed or pressed for time (females 36.4%, males 29.6%; the difference is statistically significant). | Table 8.1!D46; Table 8.1!C46; Table 8.1!B46 | ABS SE-of-difference test (SE = MoE / 1.96) |
| C13 | The share who always or often feel rushed was highest for 'Parent in couple with children under 15' (50.7%) and lowest for 'Lone person 65 years and over' (6.7%) (statistically significant difference). The highest was not statistically different from the next highest, 'Lone parent with children under 15' (49.5%). | Table 8.1!D27; Table 8.1!D29; Table 8.1!D35 | max, second-highest and min point estimates; ABS SE-of-difference test (highest vs lowest, highest vs second-highest) |
| C14 | 41.8% of people employed full-time and 39.1% of people employed part-time always or often feel rushed (full-time vs part-time statistically significant), compared with 17.3% of people not in the labour force (full-time vs not in the labour force statistically significant). | Table 8.1!D22; Table 8.1!D23; Table 8.1!D25 | ABS SE-of-difference test (full-time vs not in labour force; full-time vs part-time) |
| C15 | 37.6% of people who provided unpaid care in the previous four weeks always or often feel rushed, compared with 32.4% of those who did not (statistically significant). | Table 8.1!D41; Table 8.1!D42 | ABS SE-of-difference test |
| C16 | Among people who always or often feel rushed, the most common main reason given was 'Balancing work and family' (41.5%), followed by 'Work' (20.5%). | Table 8.3!D9; Table 8.3!D12 | ranking of point estimates; no significance claim because both shares come from the same respondents (independence-based z = 16.6 shown for reference only) |
| C20 | Counting paid work and study together with unpaid work, females aged 15 and over averaged 8:01 of work a day (3:38 of paid work and study and 4:23 of unpaid work) and males 7:56 (4:48 and 3:08), a difference of 5 minutes that is not statistically significant. Unpaid work made up 55% of females' total and 39% of males'. | Table 2.5!E155; Table 2.5!J155; Table 2.5!E81; Table 2.5!J81 | derived: total = ABS employment and education + ABS total unpaid work (total-population averages); SE of each total = sqrt(SE1^2 + SE2^2); ABS SE-of-difference test between totals |
| C21 | 'Parent in couple with children under 15' had the longest combined working day: 10:56 (4:58 of paid work and study and 5:58 of unpaid work), compared with 7:58 for all people aged 15 and over (4:12 and 3:46), 178 minutes more. 'Lone parent with children under 15' was not statistically different at 10:38 (3:43 and 6:55). | Table 2.5!E204; Table 2.5!J204; Table 2.5!E229; Table 2.5!J229; Table 2.5!E206; Table 2.5!J206 | derived: totals as in C20; ranking of point estimates excluding 'Other'; ABS SE-of-difference test between first and second |
| C22 | Among parents in couples with children under 15, female parents averaged 11:02 of combined work a day (3:35 of paid work and study and 7:27 of unpaid work) and male parents 10:50 (6:16 and 4:34), a not statistically significant difference. Unpaid work made up 68% of female parents' total and 42% of male parents'. | Table 2.5!E130; Table 2.5!J130; Table 2.5!E56; Table 2.5!J56 | derived: totals as in C20; ABS SE-of-difference test between totals |
OPEN THE NUMBERS
Download the research
Version 1.2.0. The ZIP includes all seven charts (SVG, PNG and CSV), the 12 detailed tables, the full restructured dataset of 25,110 ABS values with error measures and source cells, the claim and source registers, methods and the scripts used. Download the ABS source files separately using the recorded URL and checksum.
USE THIS RESEARCH
Cite and link to this report
Reusing charts and data
You may reproduce the supplied charts and tables with source notes intact, credit “Kangamall analysis of Australian Bureau of Statistics data” and link to this report. Identify modifications. ABS-derived data is available under the ABS attribution terms. This permission does not cover copying the full article or imply endorsement. Download reuse notes.
FOR MEDIA AND WRITERS
Reporting on this research
- Name of the report
- Australian Time Use Report 2026 (Kangamall Research)
- Credit line
- Kangamall analysis of Australian Bureau of Statistics data, linked to https://kangamall.au/research/australias-24-hours/
- Charts
- Download all charts (PNG, SVG and CSV), or use the download links under each figure. Keep the source notes on each chart.
- Data
- Complete research package, including every number’s source cell.
- Contact
- support@kangamall.au
Please cite the version and data period with any figure, and link each finding to its anchor on this page. No quotation is attributed to anyone in this report; contact us for comment.