Summary
Australian households spent $1.54 trillion on consumption in 2025–26. Housing and utilities took 24.4% of it, followed by miscellaneous goods and services (14.2%, which includes insurance and financial services), transport (10.1%) and recreation and culture (10.0%). Food took 9.4% and education services 3.6%. The figures are shares of national household final consumption expenditure (HFCE), which includes the estimated rent of owner-occupied homes, so they describe the national consumption mix rather than a typical family budget. [S01, S02]
Over the decade from 2015–16, housing and utilities gained 1.27 percentage points of the total, and accommodation and catering 1.55 points. In the latest year, spending rose 5.3% while the volume of consumption rose 2.2%, so more than half of the increase reflected higher prices. [S01]
At a glance
Household final consumption expenditure in 2025–26 [S01]
Share spent on food purchases and catering combined [S01]
Rise in the housing and utilities share since 2015–16 [S01]
Key findings
1A quarter of consumption goes on housing and utilities
Housing and utilities took 24.4% of consumption in 2025–26, or $374.6 billion. [S01]
2Two-thirds of housing consumption is imputed rent
Of the housing total, $249.2 billion is imputed rent: the estimated value of living in a home the occupant owns. Rent actually paid to landlords came to $73.7 billion. [S01, S02]
3Food and eating out account for 15.3% of consumption
Food purchases came to $144.4 billion and catering to $91.6 billion, together 15.3% of consumption. Alcohol and tobacco are recorded separately. [S01]
4Housing, accommodation and catering, and health gained share over the decade
From 2015–16 to 2025–26 the housing and utilities share rose 1.27 points, accommodation and catering 1.55 points (accommodation +0.97, catering +0.58) and health 0.70 points. Alcohol and tobacco had the largest fall, 1.45 points. [S01]
5Higher prices accounted for more than half of last year's spending growth
Consumption spending rose 5.3% between 2024–25 and 2025–26. Its volume rose 2.2% and its implicit price deflator 3.0%. [S01]
6Domestic household travellers spent $146.7 billion in 2024–25
The figure comes from the Tourism Satellite Account and covers accommodation, meals, transport, shopping and other products; it is reported separately from the national total. [S06, S07]
The national spending map
Housing and utilities is the largest category, at $374.6 billion; it combines rent and other dwelling services with electricity, gas and other fuel. Miscellaneous goods and services, the next largest group, is a defined ABS grouping that includes insurance and financial services. [S01]
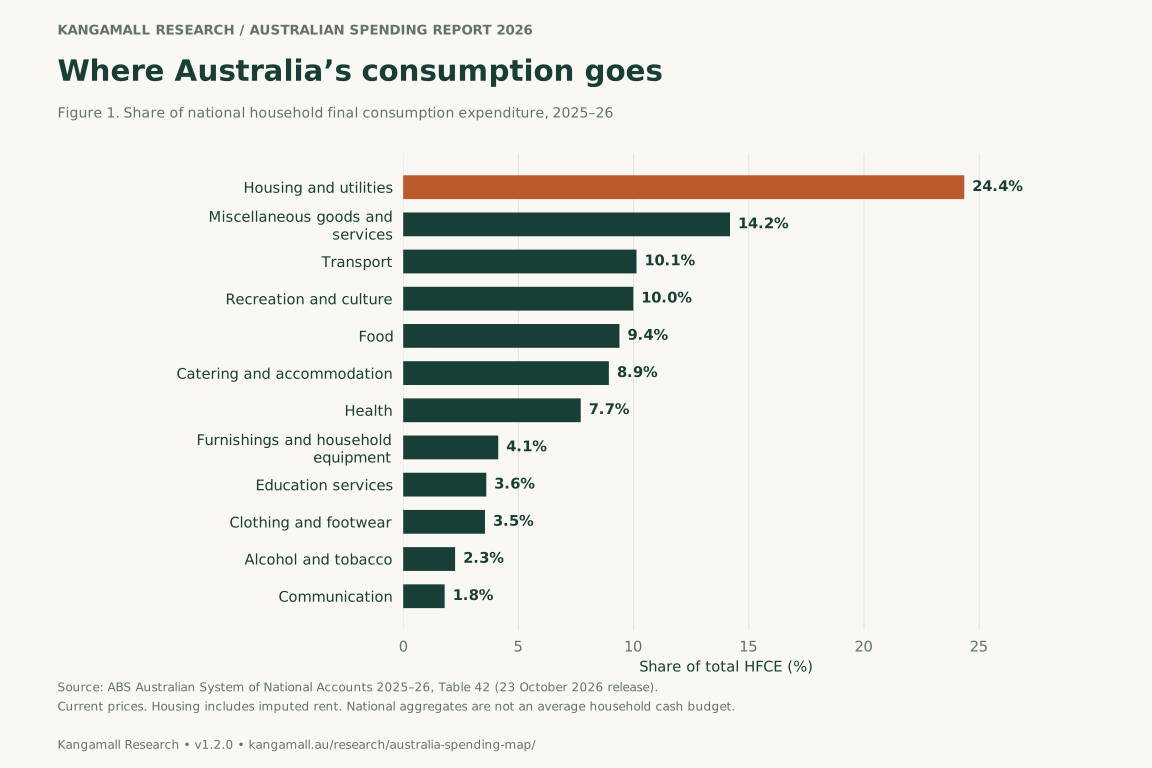
Figure 1. National consumption shares
Share of total HFCE, 2025–26 (%)- Housing and utilities24.4%
- Miscellaneous goods and services14.2%
- Transport10.1%
- Recreation and culture10.0%
- Food9.4%
- Catering and accommodation8.9%
- Health7.7%
- Furnishings and household equipment4.1%
- Education services3.6%
- Clothing and footwear3.5%
- Alcohol and tobacco2.3%
- Communication1.8%
The chart uses the same values as the downloadable figure. A text data table is available below.
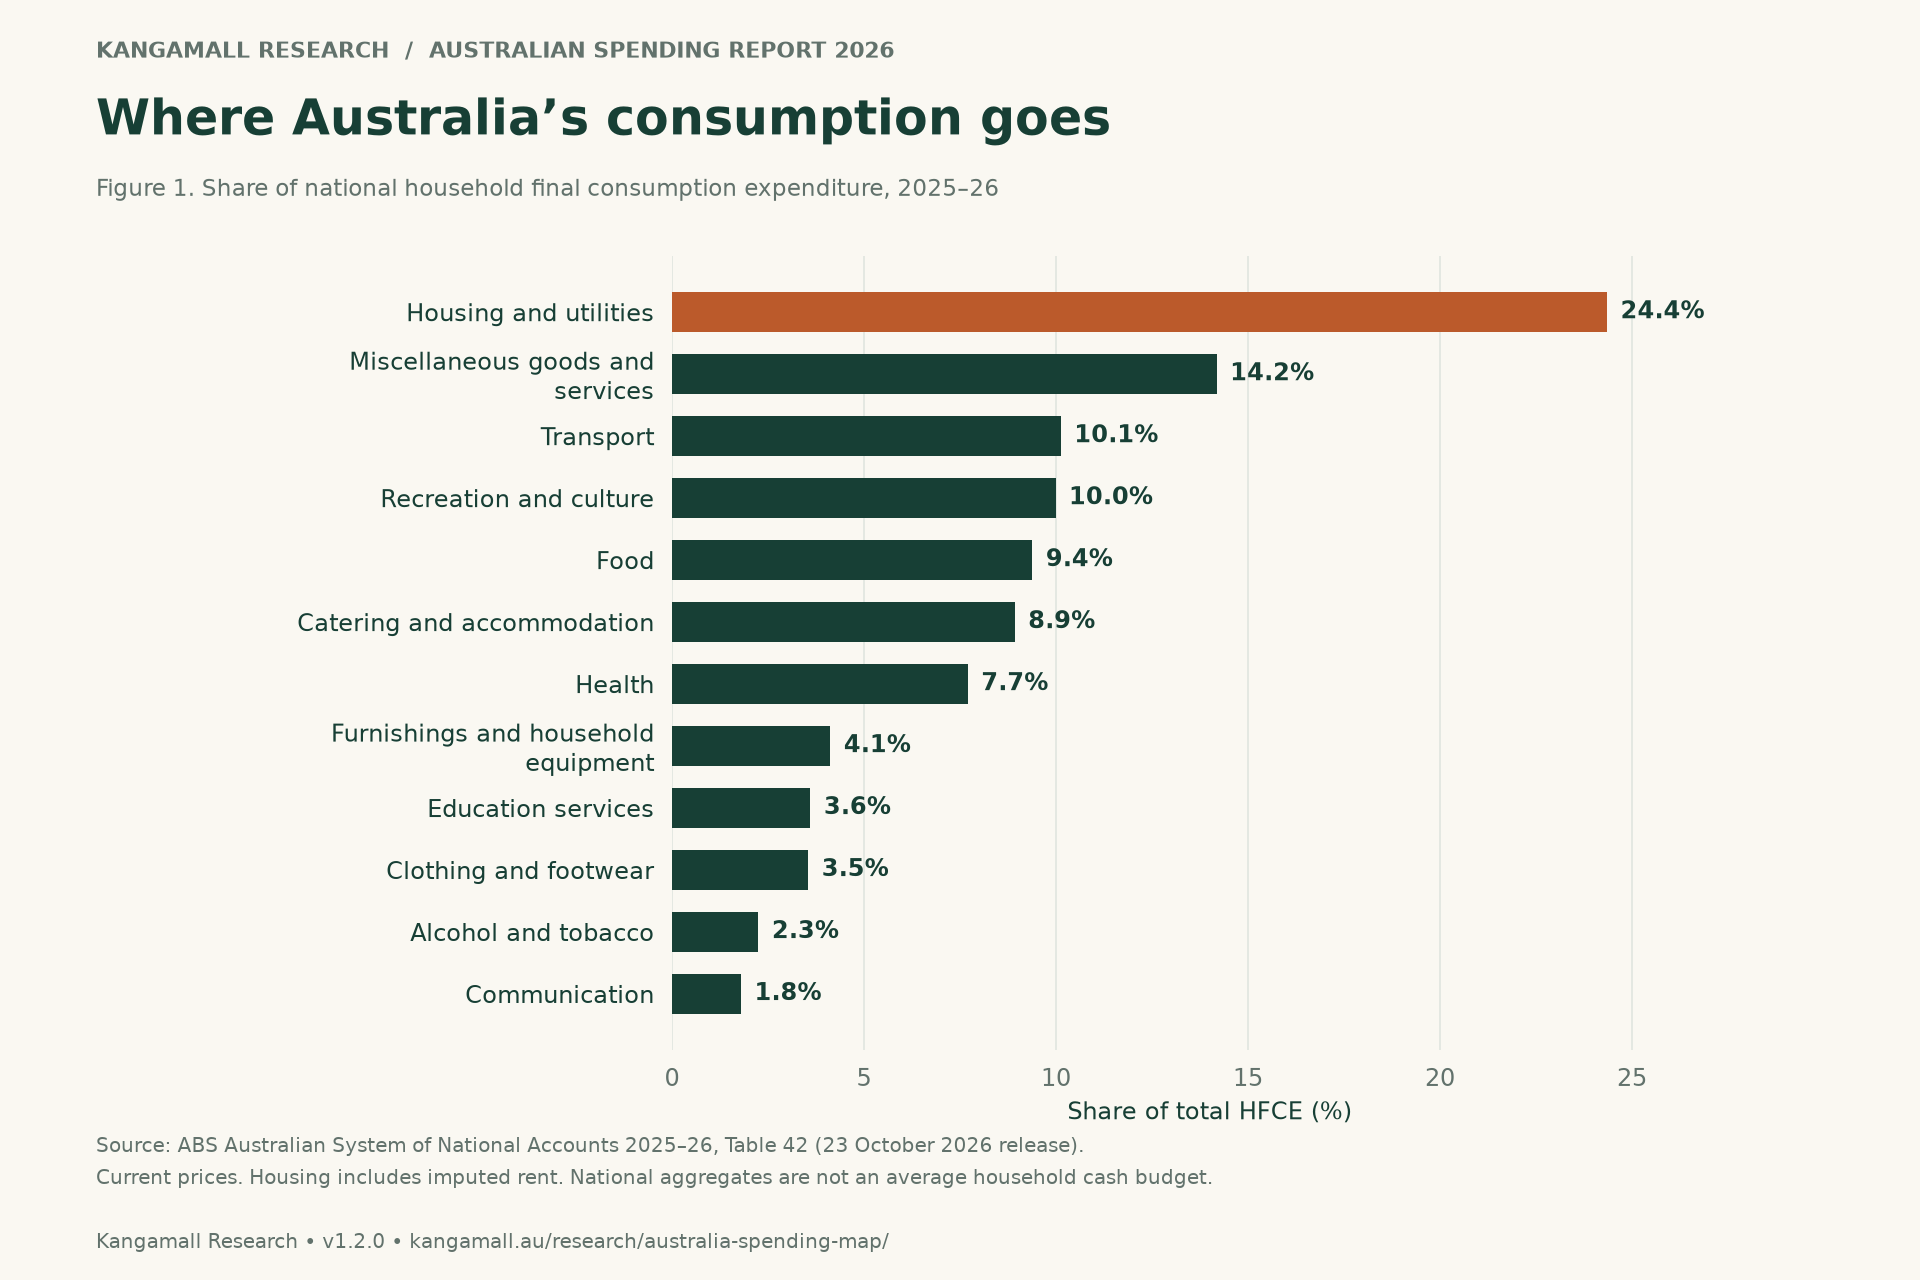
View Figure 1 data as a table
| Category | Share (%) |
|---|---|
| Housing and utilities | 24.35 |
| Miscellaneous goods and services | 14.18 |
| Transport | 10.13 |
| Recreation and culture | 9.99 |
| Food | 9.39 |
| Catering and accommodation | 8.93 |
| Health | 7.70 |
| Furnishings and household equipment | 4.13 |
| Education services | 3.61 |
| Clothing and footwear | 3.55 |
| Alcohol and tobacco | 2.25 |
| Communication | 1.80 |
| Consumption category | AUD billion | Share of total HFCE |
|---|---|---|
| Housing and utilities | 374.56 | 24.35% |
| Miscellaneous goods and services | 218.18 | 14.18% |
| Transport | 155.75 | 10.13% |
| Recreation and culture | 153.62 | 9.99% |
| Food | 144.37 | 9.39% |
| Catering and accommodation | 137.29 | 8.93% |
| Health | 118.51 | 7.70% |
| Furnishings and household equipment | 63.45 | 4.13% |
| Education services | 55.47 | 3.61% |
| Clothing and footwear | 54.60 | 3.55% |
| Alcohol and tobacco | 34.65 | 2.25% |
| Communication | 27.67 | 1.80% |
Source: Kangamall calculations from ABS ASNA 2025–26, Table 42, current prices. Categories do not overlap. Rounding may affect totals. Full annual data and source-cell references.
Two-thirds of housing consumption is imputed rent
ABS records $73.7 billion of actual housing rent and $249.2 billion of imputed rent for owner-occupiers. Imputed rent is what owner-occupiers would pay to rent their own homes; national accounts count it as consumption so that home ownership and renting are treated alike. [S01, S02]
As shares of all HFCE, actual rent is 4.79% and imputed rent 16.20%. Electricity, gas and other fuel account for 2.33%, and water and sewerage 1.03%. [S01]
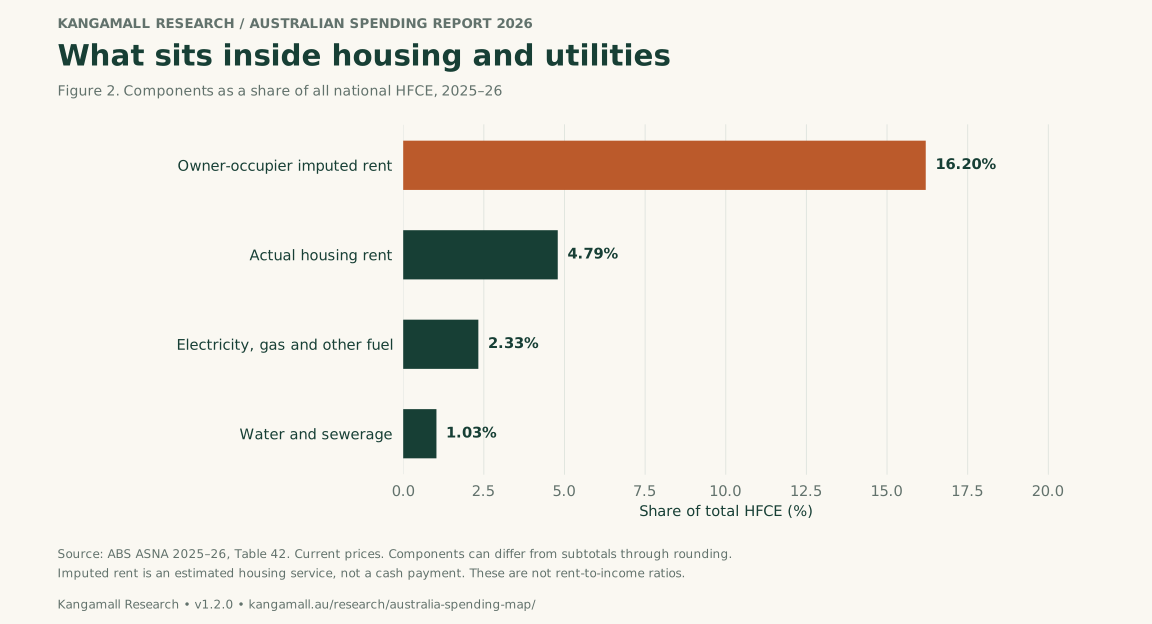
Figure 2. Housing and utilities, unpacked
Share of total HFCE, 2025–26 (%)- Imputed rent for owner-occupiers16.2%
- Actual rent for housing4.8%
- Electricity, gas and other fuel2.3%
- Water and sewerage services1.0%
The chart uses the same values as the downloadable figure. A text data table is available below.
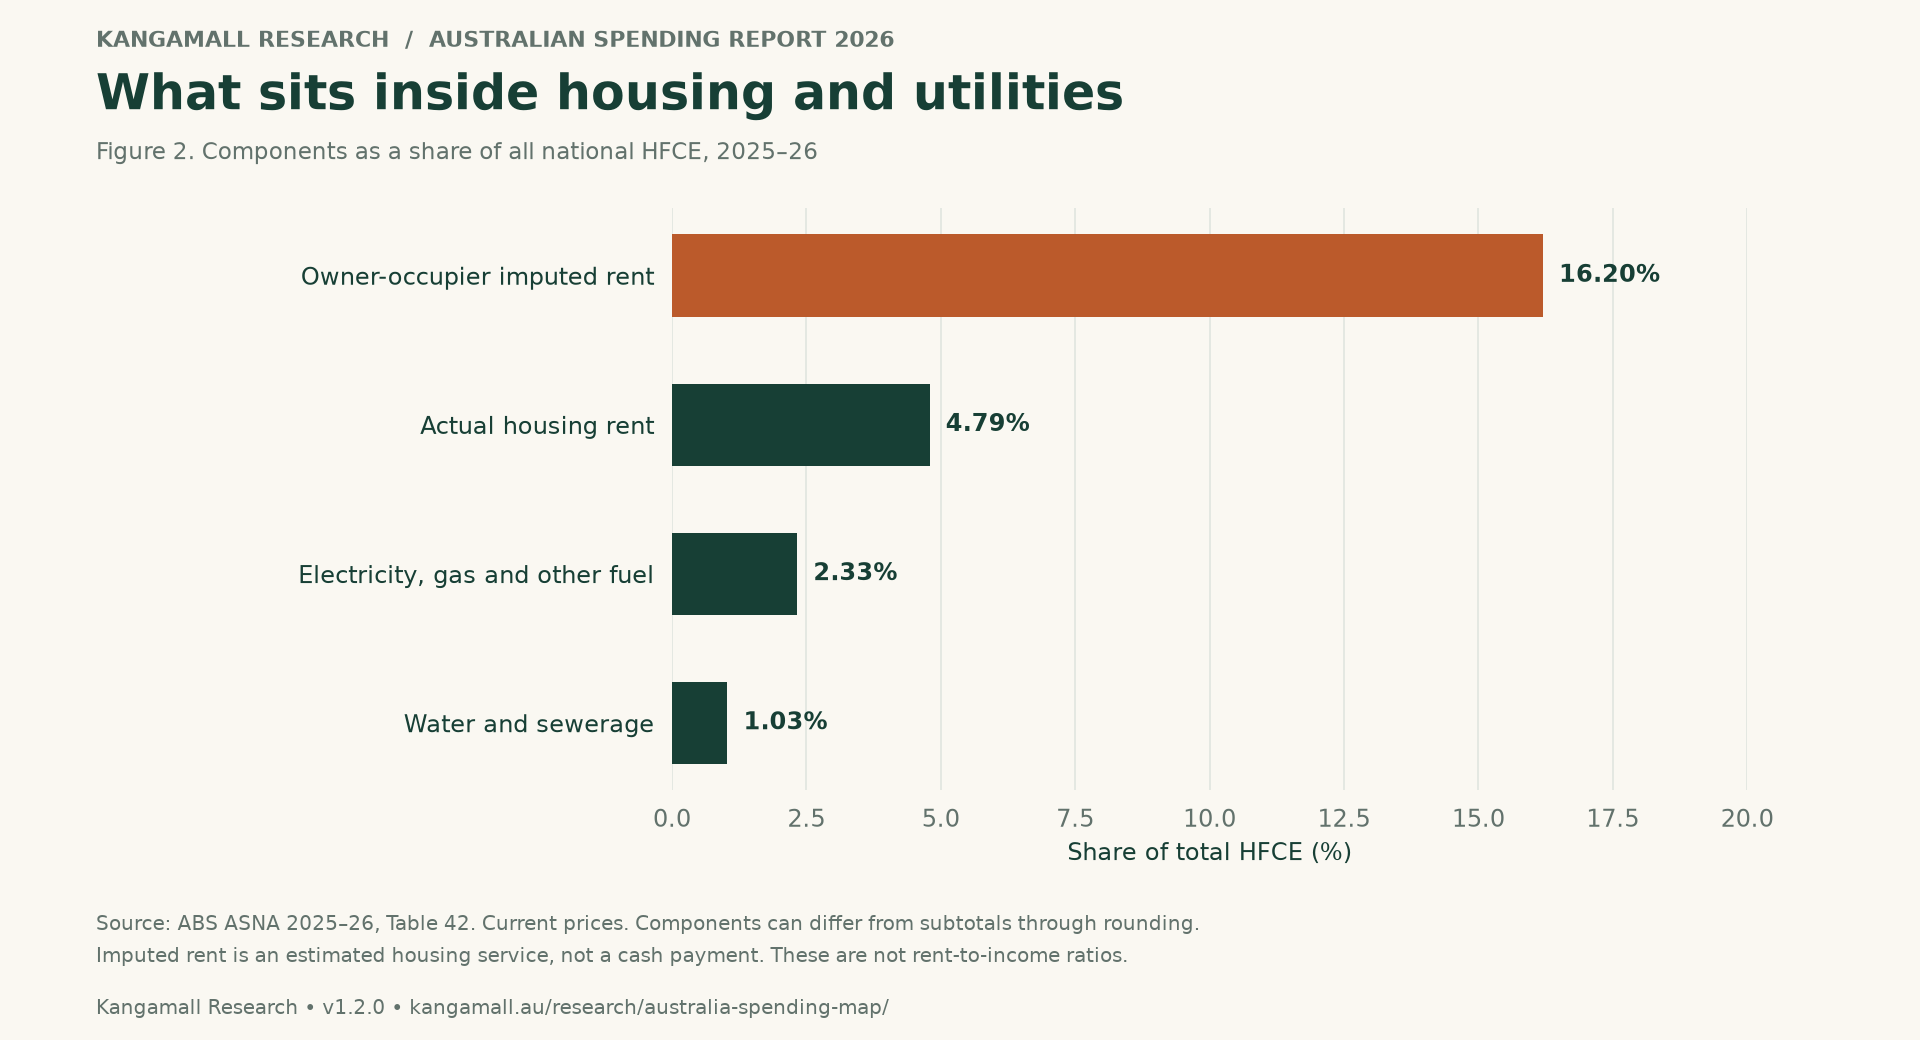
View Figure 2 data as a table
| Category | Share (%) |
|---|---|
| Imputed rent for owner-occupiers | 16.20 |
| Actual rent for housing | 4.79 |
| Electricity, gas and other fuel | 2.33 |
| Water and sewerage services | 1.03 |
These aggregates cannot show how much of a renter's income goes on rent, which needs income and housing-cost data for renters. They also exclude mortgage repayments and house purchases. Removing imputed rent would not turn HFCE into a household cash budget, because other accounting adjustments remain. [S02]
Food, eating out, transport and education
Food purchases came to $144.4 billion and catering to $91.6 billion (5.95% of consumption). Together the two make up 15.3% of HFCE. Alcohol and tobacco are recorded separately, so the pair is not a complete food-and-drink budget. [S01]
Transport's $155.8 billion splits into vehicle purchases ($38.7 billion), vehicle running costs ($66.6 billion) and transport services ($50.4 billion). It covers every kind of trip, not commuting alone. [S01]
Education services came to $55.5 billion. It covers household spending only, not government funding, and excludes child care, which ABS classifies elsewhere. [S01, S02, S05]
What changed over a decade?
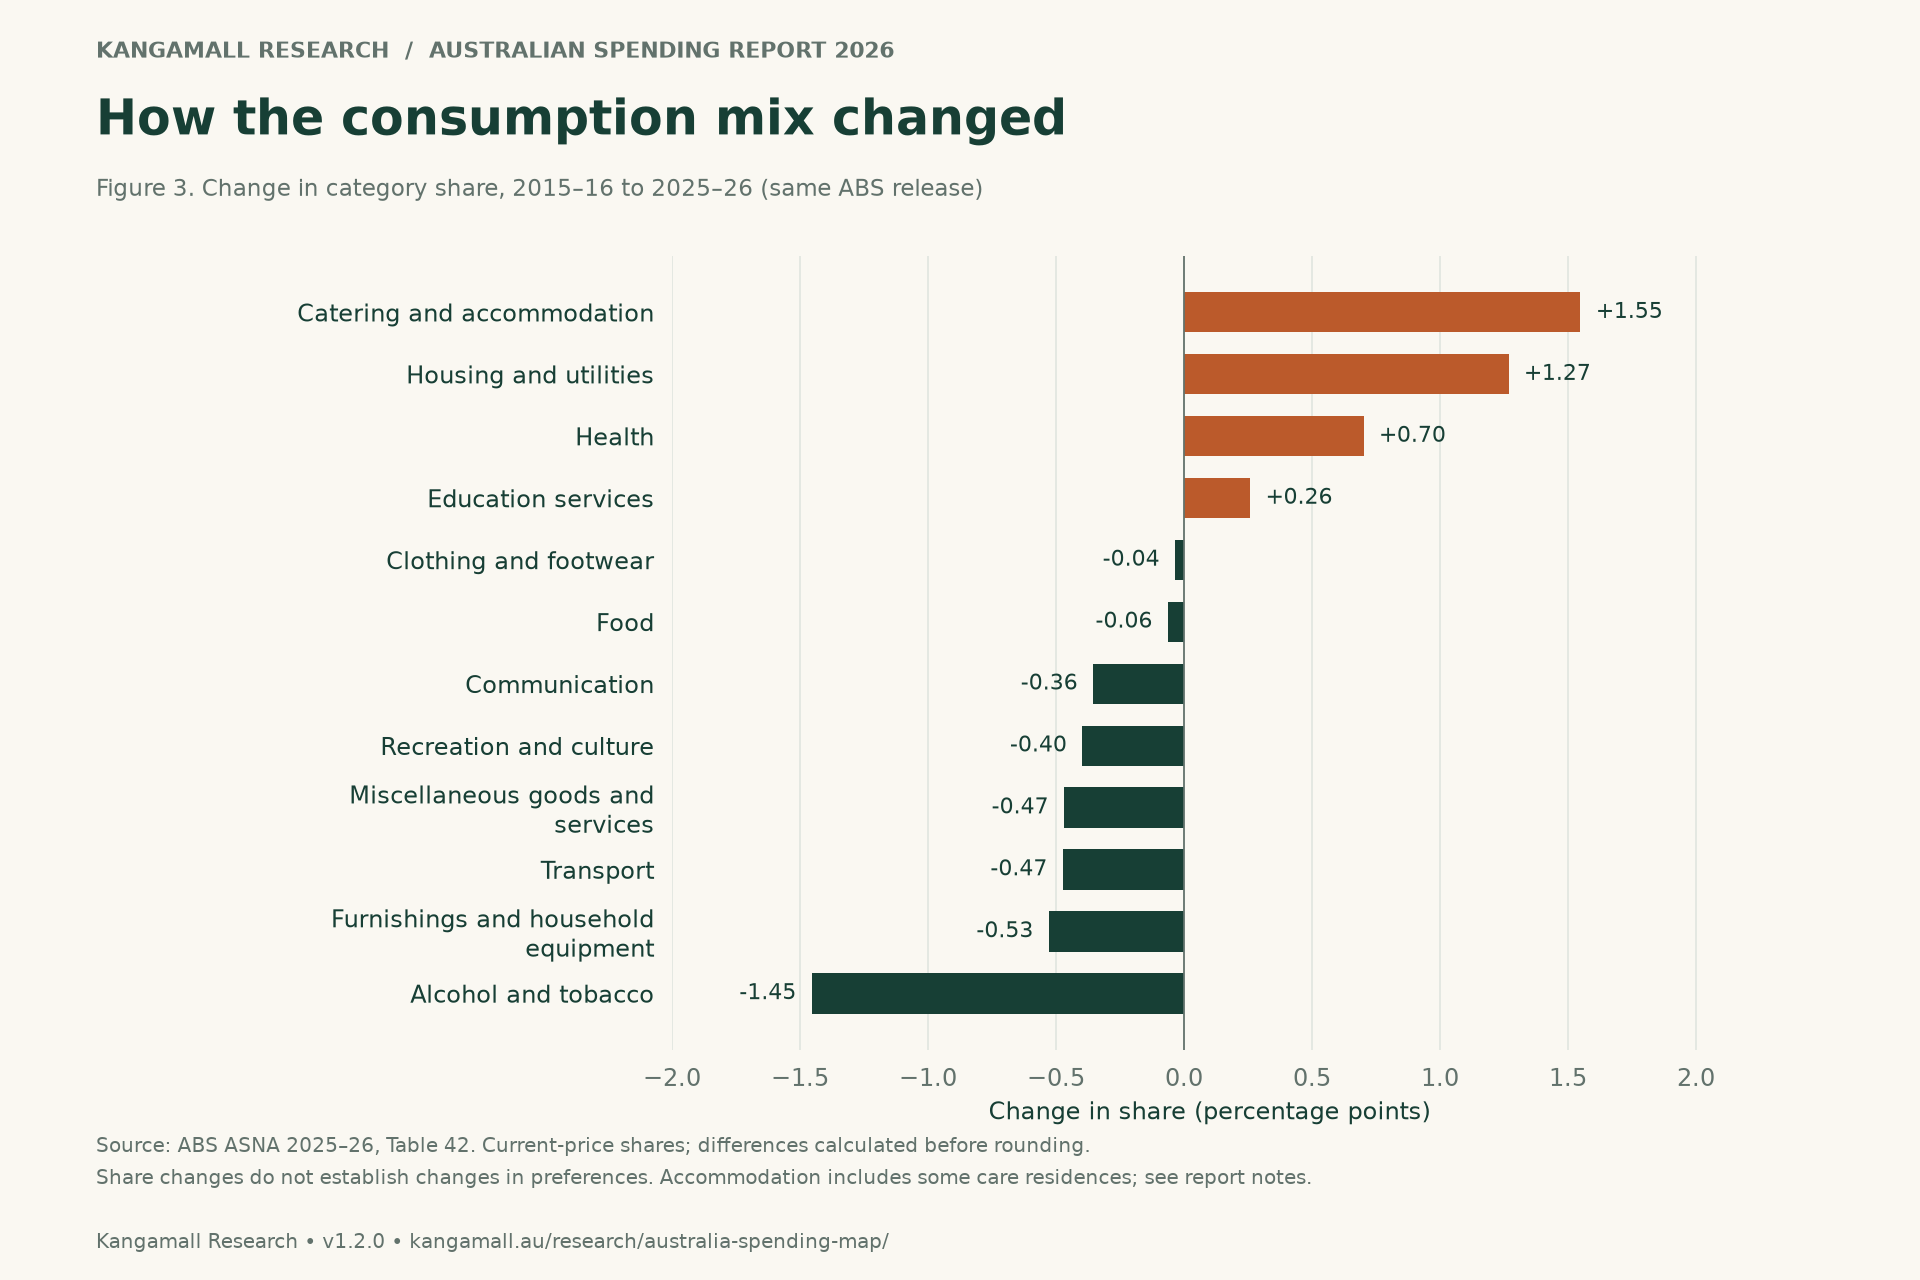
Housing and utilities rose from 23.08% of consumption in 2015–16 to 24.35% in 2025–26, a gain of 1.27 percentage points. Catering and accommodation gained 1.55 points, health 0.70 points and education 0.26 points. [S01]
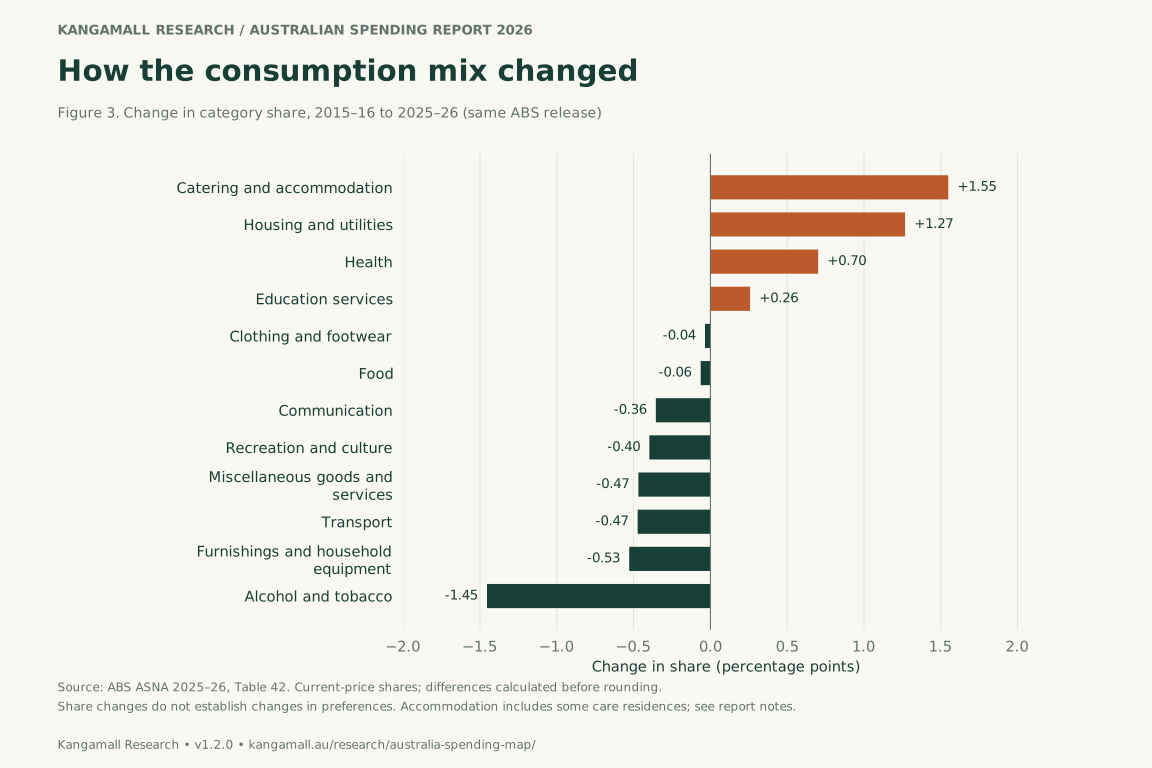
Figure 3. Ten years of changing shares
Change in share, 2015–16 to 2025–26 (percentage points)- Catering and accommodation+1.55
- Housing and utilities+1.27
- Health+0.70
- Education services+0.26
- Clothing and footwear-0.04
- Food-0.06
- Communication-0.36
- Recreation and culture-0.40
- Miscellaneous goods and services-0.47
- Transport-0.47
- Furnishings and household equipment-0.53
- Alcohol and tobacco-1.45
The chart uses the same values as the downloadable figure. A text data table is available below.
View Figure 3 data as a table
| Category | Change (percentage points) |
|---|---|
| Catering and accommodation | 1.55 |
| Housing and utilities | 1.27 |
| Health | 0.70 |
| Education services | 0.26 |
| Clothing and footwear | -0.04 |
| Food | -0.06 |
| Communication | -0.36 |
| Recreation and culture | -0.40 |
| Miscellaneous goods and services | -0.47 |
| Transport | -0.47 |
| Furnishings and household equipment | -0.53 |
| Alcohol and tobacco | -1.45 |
The comparison year matters. Transport is 0.47 points below its 2015–16 share but 2.62 points above its 2020–21 share, when pandemic restrictions held travel down. The data include all 11 annual observations and a pre-pandemic 2018–19 reference so that readers can choose the comparison. [S01]
| Category | 2015–16 | 2018–19 | 2020–21 | 2025–26 |
|---|---|---|---|---|
| Food | 9.45% | 9.45% | 10.33% | 9.39% |
| Housing and utilities | 23.08% | 23.43% | 24.73% | 24.35% |
| Health | 7.00% | 7.17% | 7.75% | 7.70% |
| Transport | 10.60% | 10.41% | 7.51% | 10.13% |
| Education services | 3.35% | 3.42% | 3.61% | 3.61% |
| Catering and accommodation | 7.38% | 7.64% | 6.17% | 8.93% |
The alcohol-and-tobacco share fell 1.45 points, the largest fall of any category; it measures recorded spending, not smoking rates or illicit purchases. Accommodation services also include some care-related residences, so the category is broader than holiday travel. [S01, S05]
Prices rose faster than volumes
Current-price HFCE grew 5.3% between 2024–25 and 2025–26; the chain-volume measure, which removes price effects, grew 2.2%. The gap was widest for education: spending rose 6.9% and volume 1.9%. [S01]
| Series | Current-price growth | Volume growth |
|---|---|---|
| Total HFCE | 5.3% | 2.2% |
| Food | 4.4% | 2.5% |
| Education services | 6.9% | 1.9% |
| Health | 7.9% | 4.7% |
| Catering | 4.9% | 1.5% |
| Accommodation services | 12.5% | 7.7% |
| Total transport | 2.8% | 1.0% |
| Actual rent for housing | 6.0% | 1.6% |
| Imputed rent for owner-occupiers | 6.0% | 1.6% |
These are national totals, not per-person measures. Shares use current prices; volume measures are used only to compare a series with itself over time. Calculation data.
Where does tourism fit?
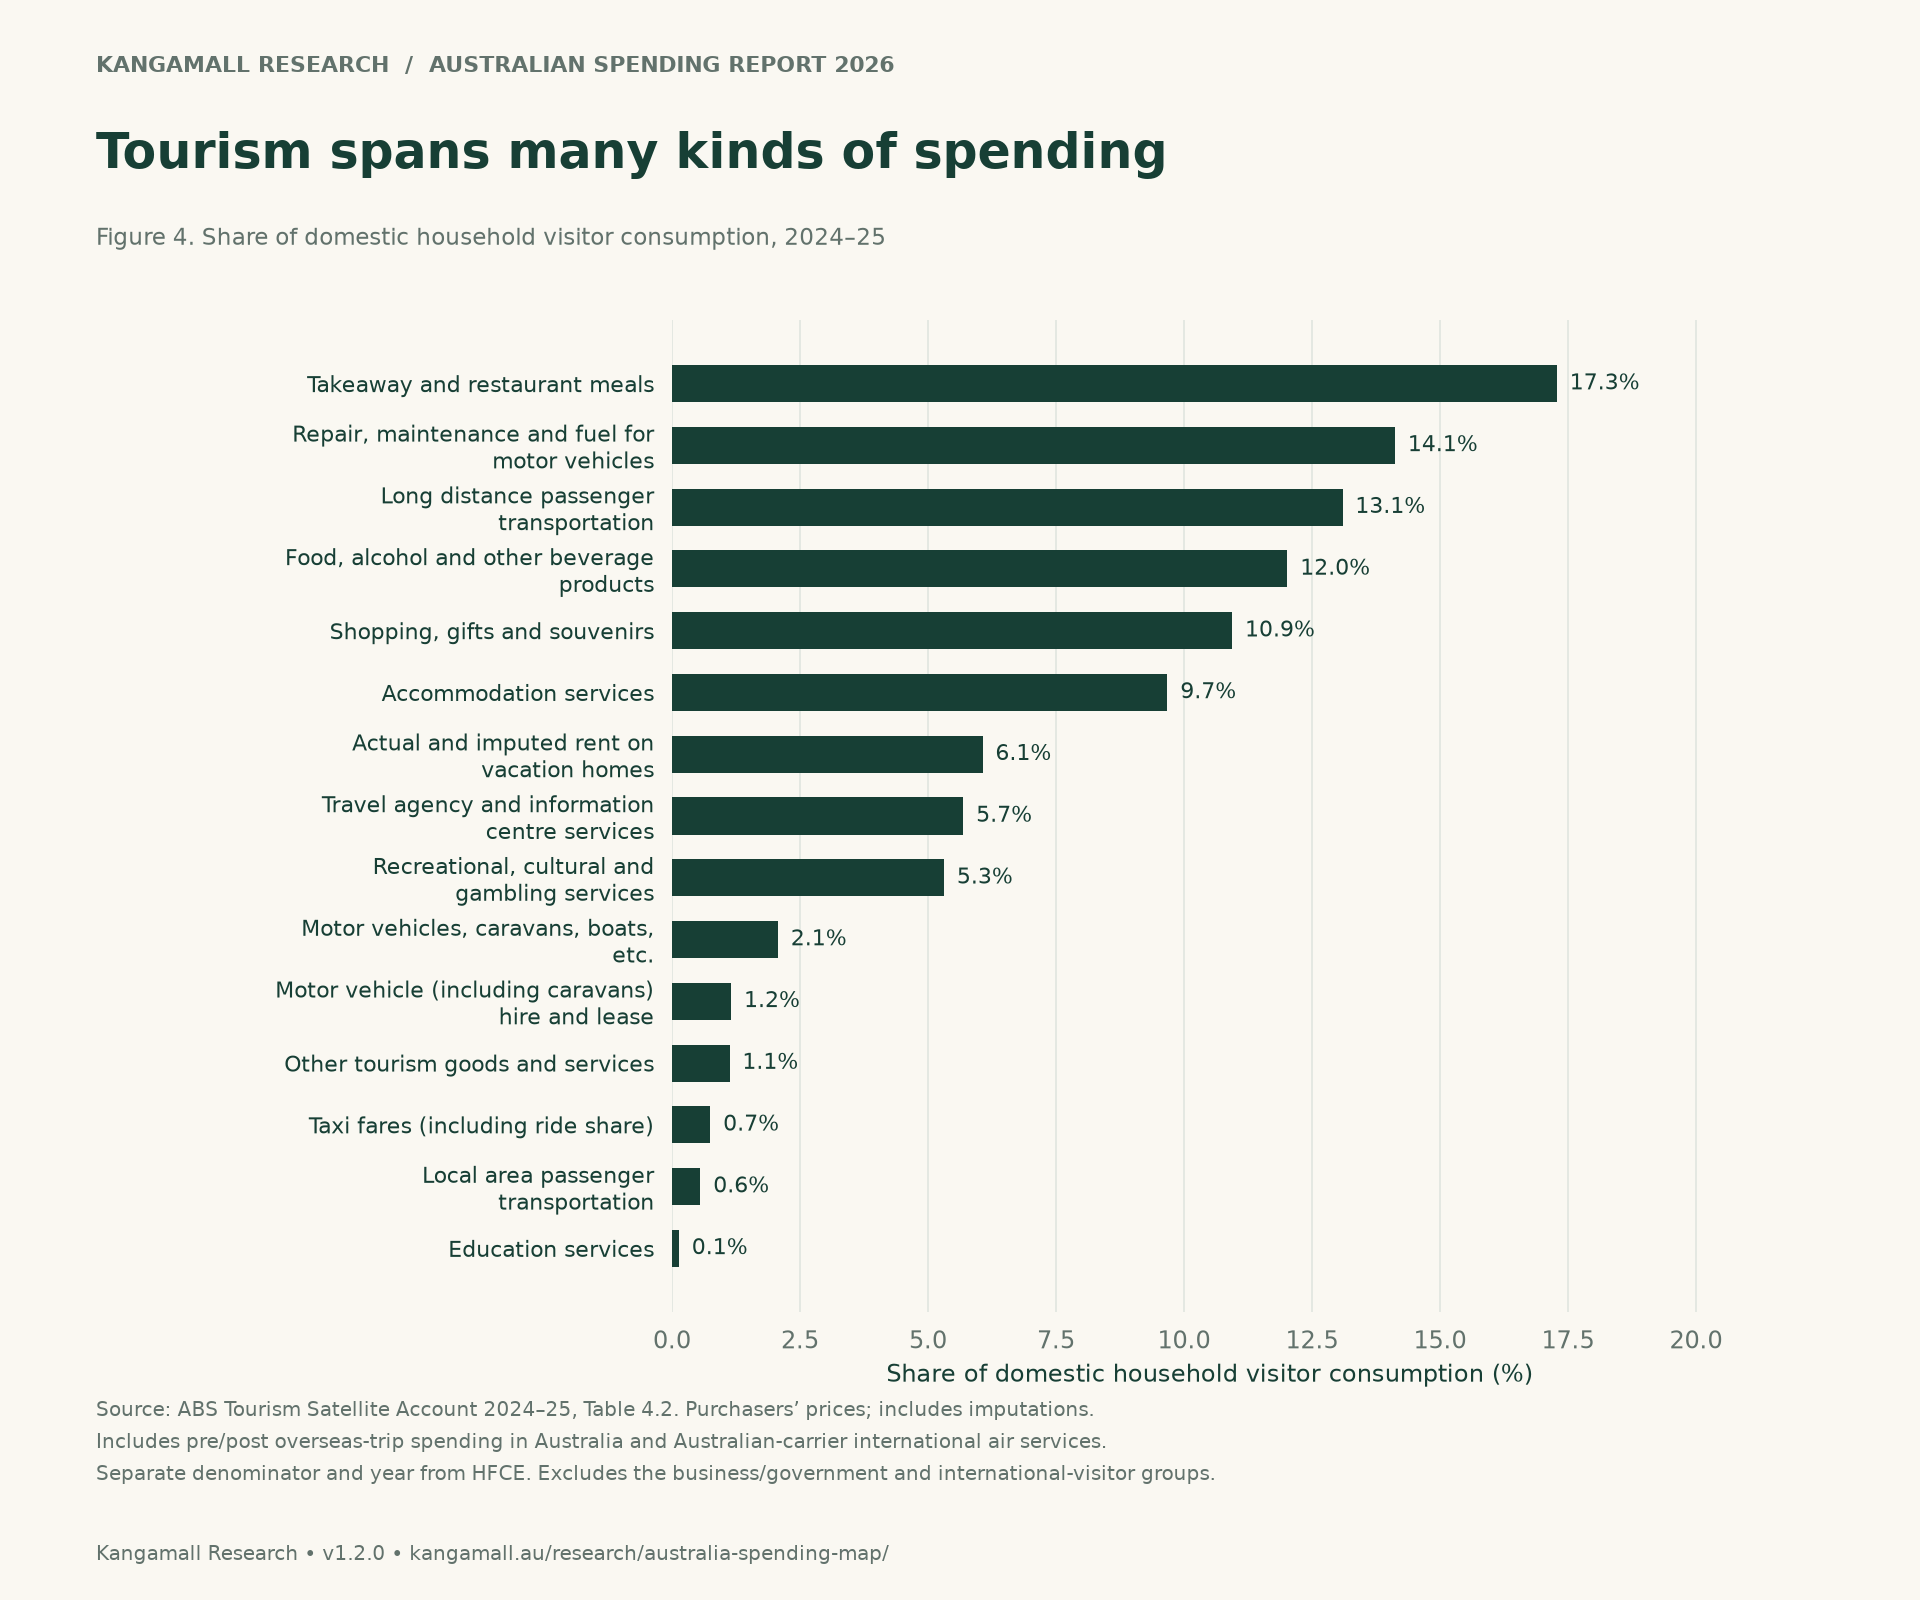
Tourism spending runs across accommodation, meals, transport, shopping and other products, so adding a tourism slice to the national chart would count some spending twice. It is shown separately, with its own denominator and year. [S06, S07]
In the 2024–25 Tourism Satellite Account, domestic household visitors spent $146.7 billion. Figure 4 shows how that total was spread. Business and government travel and international visitors are recorded separately. The definition includes spending in Australia before and after overseas trips and international flights on Australian carriers, so it does not equal domestic-holiday spending. [S07, Table 4.2 footnotes b–d]
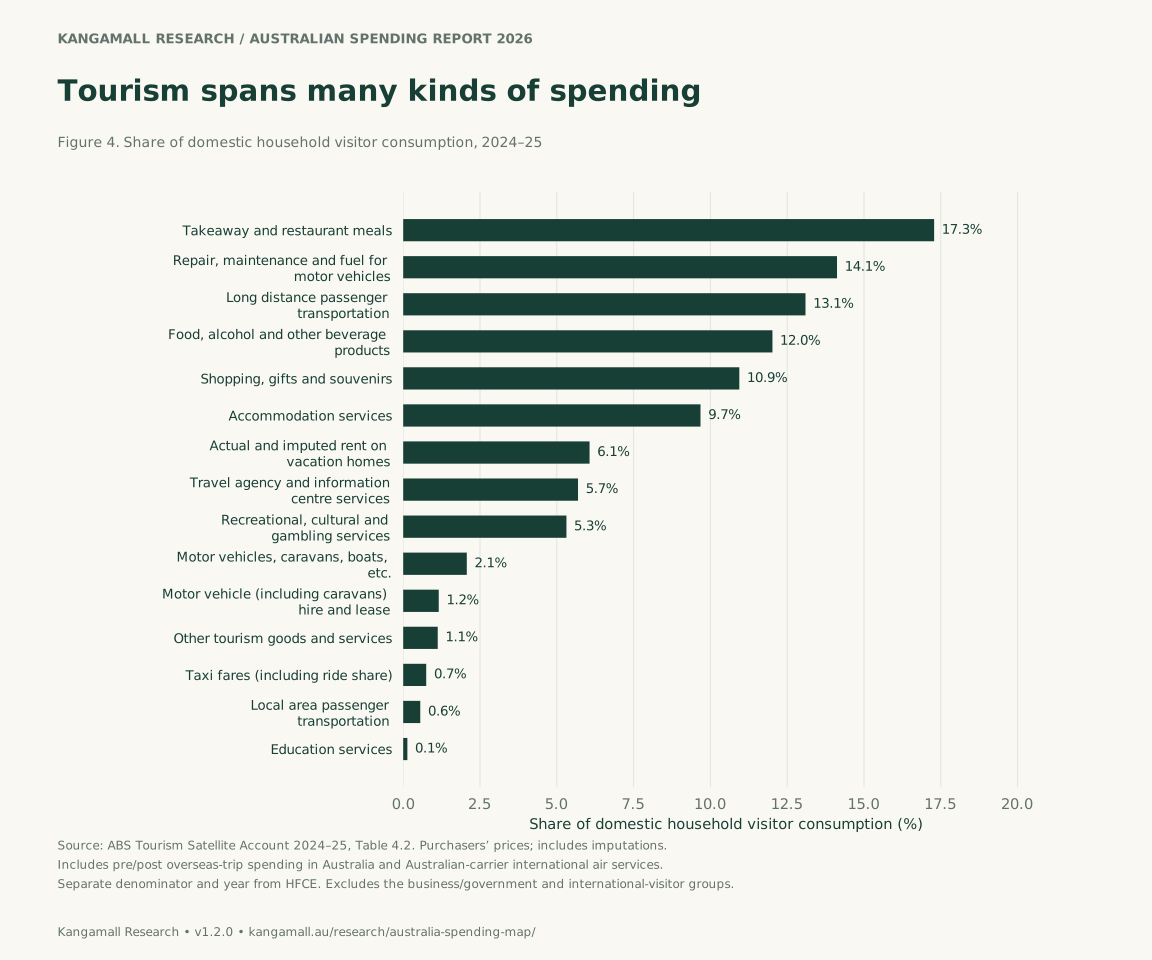
Figure 4. The composition of tourism consumption
Share of domestic household visitor consumption, 2024–25 (%)- Takeaway and restaurant meals17.3%
- Repair, maintenance and fuel for motor vehicles14.1%
- Long distance passenger transportation13.1%
- Food, alcohol and other beverage products12.0%
- Shopping, gifts and souvenirs10.9%
- Accommodation services9.7%
- Actual and imputed rent on vacation homes6.1%
- Travel agency and information centre services5.7%
- Recreational, cultural and gambling services5.3%
- Motor vehicles, caravans, boats, etc.2.1%
- Motor vehicle (including caravans) hire and lease1.2%
- Other tourism goods and services1.1%
- Taxi fares (including ride share)0.7%
- Local area passenger transportation0.6%
- Education services0.1%
The chart uses the same values as the downloadable figure. A text data table is available below.
View Figure 4 data as a table
| Category | Share (%) |
|---|---|
| Takeaway and restaurant meals(c) | 17.28 |
| Repair, maintenance and fuel for motor vehicles | 14.12 |
| Long distance passenger transportation(d) | 13.10 |
| Food, alcohol and other beverage products | 12.02 |
| Shopping, gifts and souvenirs | 10.94 |
| Accommodation services | 9.68 |
| Actual and imputed rent on vacation homes | 6.07 |
| Travel agency and information centre services | 5.69 |
| Recreational, cultural and gambling services | 5.31 |
| Motor vehicles, caravans, boats, etc. | 2.07 |
| Motor vehicle (including caravans) hire and lease | 1.16 |
| Other tourism goods and services | 1.12 |
| Taxi fares (including ride share) | 0.75 |
| Local area passenger transportation | 0.56 |
| Education services | 0.14 |
The tourism figures predate the October 2026 national-account revisions, so the 2024–25 tourism total is not divided by the 2025–26 consumption total, and no detailed tourism trend is shown while ABS flags limitations around its newer domestic tourism source. [S06, S08]
Method, limits and how to use this report
This is a descriptive analysis of published aggregate estimates. Every national share and change is calculated from a single, revised ABS release. Shares are category current-price amounts divided by total HFCE in the same financial year and release; changes in shares are percentage points. Housing combines two non-overlapping ABS aggregates. The overseas-spending adjustment is already allocated to the relevant categories and is not added again. [S01, S03]
Using a single October 2026 vintage matters: ABS revised health, care-related consumption and international-service measurement. Comparing an old published level with a revised new one could mix statistical revisions with economic change. [S04, S05]
The results describe national consumption, including non-cash items and non-profit institutions serving households. They cannot be applied as the budget of a specific household, income group or life stage. They do not establish causation or willingness to buy local services. The complementary Kangamall Australian Time Use Report 2026 examines a different question and population measure; the two datasets are not linked at household level.
You may reproduce the supplied Kangamall charts with their source notes intact and the credit “Kangamall analysis of Australian Bureau of Statistics data”, linked to this report. Identify any changes you make. ABS-derived data remains subject to the ABS attribution terms. This permission covers the supplied charts; it does not imply endorsement or permission to copy the full article.
Data and references
Method and data dictionary · Source register · Extracted observations · Full annual category shares
- S01: ABS (2026), Australian System of National Accounts, 2025–26, Table 42, released 23 October 2026. All main calculations use this vintage.
- S02: ABS (2026), HFCE concepts, paragraphs 10.13–10.18.
- S03: ABS (2026), Adjustments made to HFCE, paragraphs 10.26–10.29.
- S04: ABS (2026), Impacts from the 2026 Annual National Accounts historical revisions.
- S05: ABS (2026), Improvements to the measurement of health care and social assistance.
- S06: ABS (2025), Tourism Satellite Account, 2024–25, including changes in this issue.
- S07: ABS (2025), Tourism consumption characteristics, Table 4.2, released 17 December 2025.
- S08: ABS (2025), Tourism Satellite Account methodology, 2024–25.
Sources checked again on 27 October 2026. ABS data attribution is governed by its copyright and licensing terms. This analysis is published under the organisational byline Kangamall Research; no ABS endorsement is claimed. No external research sponsor is recorded for this report. Kangamall is developing a consumer information platform with possible future directory and service offerings; none of those activities supplies the data or determines these calculations. Kangamall Research reviewed and edited this report and is responsible for its content. AI-assisted tools were used for data processing, calculation checks and drafting. All extracted values were checked against the original ABS workbook cells, and every share and change was recalculated with a separate implementation. The report has not been externally peer reviewed.
Version and corrections
- Version 1.2.0, 6 November 2026. Text revised for clarity, and the price and volume finding added to the key findings. No data or calculations changed.
- Version 1.1.1, 6 November 2026. Reviewed and edited by Kangamall Research; the note on how the report was produced was revised. No data, calculations or findings changed.
- Version 1.1.0, 31 October 2026. Renamed from "Australia's Spending Map: where consumption goes in 2025–26" to "Australian Spending Report 2026: Where Australia's consumption goes". Added a summary, at-a-glance figures and headed key findings, and updated the chart headers. No data, calculations or findings changed. The version 1.0.0 package remains available at https://kangamall.au/research/australia-spending-map/downloads/v1.0.0/kangamall-spending-map-v1.0.0.zip.
- Version 1.0.0, 27 October 2026. Initial release. Temporarily withdrawn on 28 October and restored without changes on 31 October 2026.
The data snapshot is fixed to the source versions above. Later substantive changes will receive a dated correction or version note on this page. When citing the analysis, retain the version and source period so that readers can identify the results you used.
OPEN THE NUMBERS
Download the research
Version 1.2.0. The ZIP includes all four charts, figure data, annual data, source and claim registers, methods and Python scripts. Source XLSX files are downloaded separately from ABS using the recorded URLs and checksums.
USE THIS RESEARCH
Cite and link to this report
Reusing charts and data
You may reproduce the supplied charts with source notes intact, credit “Kangamall analysis of Australian Bureau of Statistics data” and link to this report. Identify modifications. ABS-derived data is available under the ABS attribution terms. This chart permission does not cover copying the full article or imply endorsement. Download reuse notes.
FOR MEDIA AND WRITERS
Reporting on this research
- Name of the report
- Australian Spending Report 2026 (Kangamall Research)
- Credit line
- Kangamall analysis of Australian Bureau of Statistics data, linked to https://kangamall.au/research/australia-spending-map/
- Charts
- Download all charts (PNG, SVG and CSV), or use the download links under each figure. Keep the source notes on each chart.
- Data
- Complete research package, including every number’s source cell.
- Contact
- support@kangamall.au
Please cite the version and data period with any figure, and link each finding to its anchor on this page. No quotation is attributed to anyone in this report; contact us for comment.